Cabinets & Legislatures in Canada
Possible functions of legislatures:
|
Factors limiting the effectiveness of legislatures:
|
|
Importance of different types of representation:
|
POLITICAL PARTY |
NUMBER OF WOMEN |
WOMEN AS % OF TOTAL |
| Liberal | 36 / 156 |
23.1 |
| Bloc Québécois | 11 / 44 |
25.0 |
| Reform Party | 3 / 59 |
5.1 |
| New Democratic Party | 8 / 20 |
40.0 |
| Progressive Conservative | 2 / 20 |
10.0 |
| TOTAL | 60 / 301 |
19.9 |
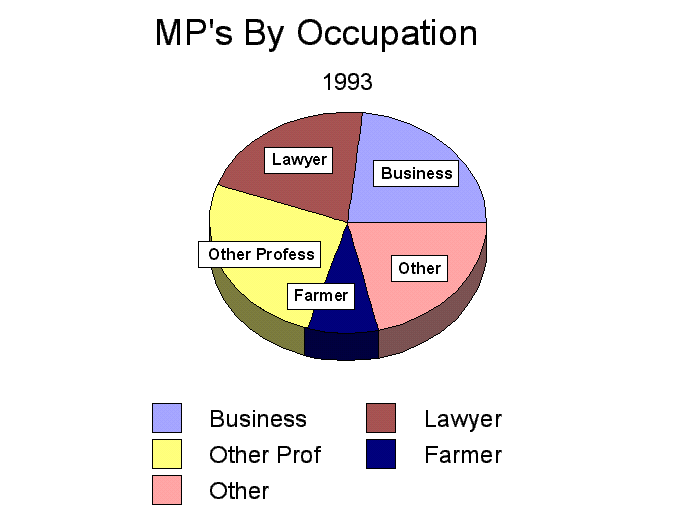
BC MLA Occupation Profile: 1996
Business: 29.3
Law: 12.0
Education: 20.0
Farming: 2.7
Government: 2.7
Union: 5.3
Other: 28.0
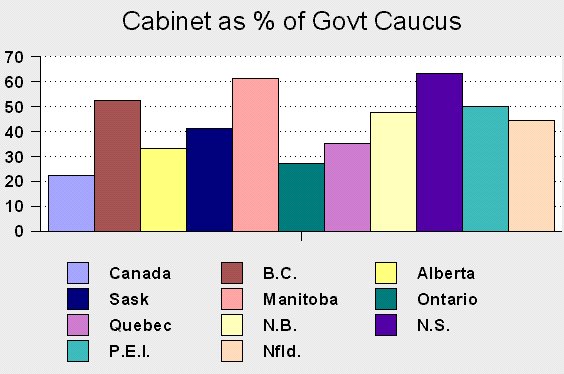
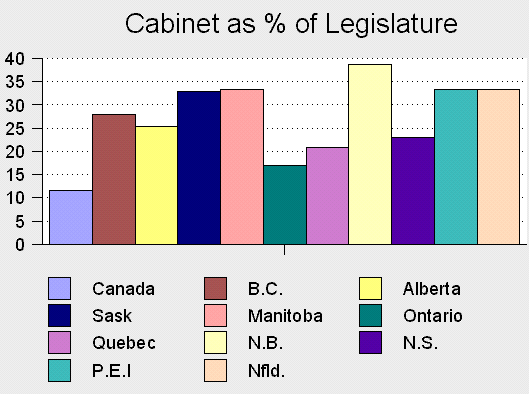
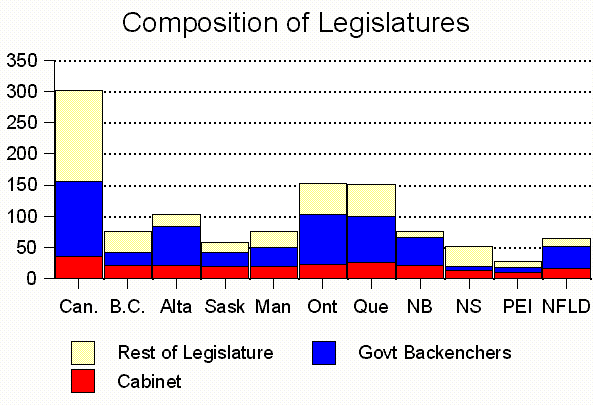
| The size of the cabinet/ministry relative
to the governing party's caucus and the legislative chamber as a whole
are among the most fundamental factors determining how effectively and
independently legislative chambers may operate in a parliamentary system
of government.
The charts below present visually the relative size of cabinets, governing caucus and legislative chambers in Canada's national and provincial legislatures. |
|
Legislature |
Basic Salary |
Non-Taxable Allowance |
Sitting Days per year avg '90-'95 |
|
B.C. |
32,812 |
16,406 |
72.5 |
|
Alta |
36,420 |
18210 |
98.2 |
|
Sask |
55,000 |
n.a. |
74.7 |
|
Manitoba |
57,065 |
n.a. |
93 |
|
Ontario |
78,007 |
n.a. |
82.8 |
|
Quebec |
63,469 |
11,417 |
79 |
|
New Brunswick |
36,485 |
14,594 |
40.2 |
|
Nova Scotia |
29,226 |
14,613 |
64.2 |
|
P.E.I. |
29,600 |
8,973 |
30 |
|
Nfld |
38,028 |
19,014 |
79.2 |
| These charts are compiled with data originally available at CANOE
and the Parliamentary
Internet sites, updated to February 1, 1999. Some material is also
drawn from R.J. Fleming & J.E. Glenn (eds.), Fleming's Canadian
Legislatures 1997, (11th.ed.) Toronto: University of Toronto Press,
1997
This page has been created primarily for use in POL-221 at Simon Fraser University in 99-1 by Andrew Heard. |