 
Home
|| Political Parties
|| Polling Data
|| Ridings
|| Marginal Seats
|| Election News
|| Women & Elections
|| Election Laws
|
||||||
|
|
 |
 |
 |
 |
 |
 |
Note: All polling data for the graphics above are entered chronologically by period of actual polling, not publication date
Provincial & regional polling data tables are available here
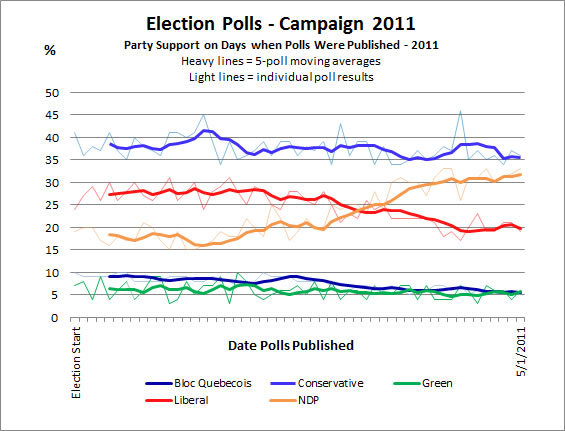
The next chart shown below shows a more complicated - and more informative - view of the levels of national support for the parties on days on which the interviews were actually conducted by the various companies. Darker shades of the same colour indicate that more than one company polled on the same day and found the same level of support.
Note that in reality, polling results usually vary from one day to another over the several days of interviewing for a poll. This is normal because of the small number of interviews made on each day. The most reliable research involves interviews over several days in order to better capture public opinion; results are combined over the total survey period to give the final levels of support reported for each party. For the sake of simplicity, the final average reported for a survey is shown for all of the specific days on which polling was conducted.
Party Support on Days When Polls Were Conducted - Campaign 2011
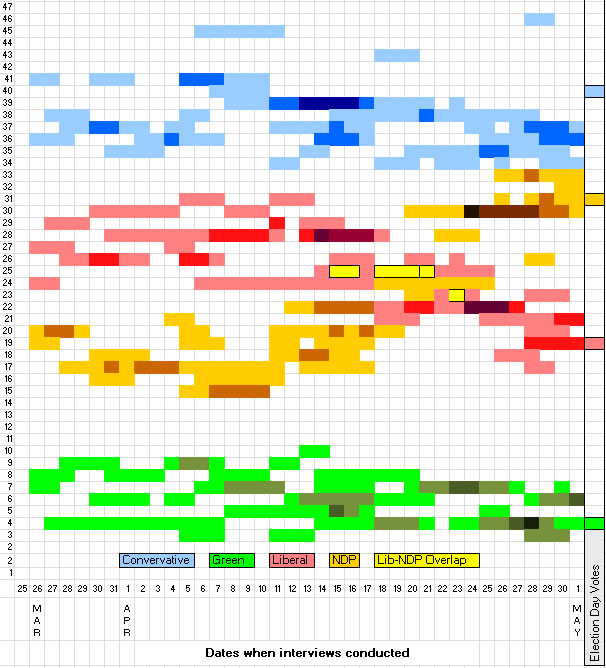
Data source: 2011 Canadian Election Polls
The chart clearly shows that substantial variations are found using different survey techniques by the different companies, even when polling companies conduct interviews on the same days. For example, there was a 10 point (46-35) spread among polls reporting Conservative support in the closing days of the campaign, April 28-29, and an 8 point (33-26) spread for the NDP. Seven polls were conducted in the period covering April 14-7, and yet the results provided an 8 point (17-24) spread for the NDP that included a healthy overlap with Liberal support. Also, polls conducted April 5-6 produced a 10 point spread for the Conservatives and an 8 point span for the Liberals. Such wide divergences seriously undermine the public`s ability to gain clear insights into party support. The most likely culprit in this variations is how different survey companies deal with the "soft" voter, but there are other explanations as well.
These variations are the result of quite different methodologies adopted by the polling companies. One difference lies in what specific questions are asked. For example, the Nanos polls simply asks an open-ended question about which party a person is likely to vote for. Ekos asks that question, but then provides a list of parties, including the Green Party. As a result, Ekos usually reports much higher Green support than Nanos. A third way of putting the questions is to attach the party leaders' names to the list of parties: i.e. "Stephen Harper's Conservative Party." But being reminded of the leader can evoke both heightened positive and negative feelings, and alter the response rates for a party. None of these three approaches are "tricks" - they are valid attempts to probe in different ways how people think when it comes time to cast their ballot. But it is an open question which of these methods produces the most accurate results.
A further difference among the companies is how aggressively they try to uncover the preferences of voters who initially say that they haven't made up their minds. If a person answers "don't know" to the first question. Most companies will follow up with a question asking about the party a person may be leaning towards. Different variations of this question may be posed repeatedly. A few companies also use a person's answers to other questions to statistically predict how they would vote, based on a model of how other voters with those share traits are known to be voting. The result is that some companies will report much lower levels of "undecided" voters than others. But the parties with the lowest levels of support are likely to include a substantial amount of soft support, voters who are only marginally attached to this party and who might easily switch to another.
While the actual level of support could have been anywhere in that range, it is more likely to lie somewhere in the middle. Alternatively, the highest extreme poll results could have been the legendary "20th poll;" the highest is mentioned here simply because those are the ones that stand out from the rest of the poll results. Statistically, polls are reliable within their margin of error 19 times out of 20; thus it is quite possible for an occasional poll to report out of range results that do not reflect reality.
Return to 2011 Canadian National Election Polls Page
![]()
I welcome any feedback and suggestions for fresh material to add to this site -
Andrew
Heard
Political
Science Department -- Simon Fraser university
copyright (c) 2008 Andrew Heard