I have several GEM mounts.
These are some star trail images
that demonstrate the total periodic error present in the mount's
RA drive gear using the following method:
you should do a rough polar alignment and then, using the altitude
adjuster, move the mount about 5 (if using a DSLR) or 10 (35mm)
degrees above or below the pole. If you don't want to disturb the mounts
polar alignment, simply slip a block of wood under the north leg.
Next, attach the camera to your scope, focus it, and aim it at a star
about 20deg above the eastern horizon. Now open the shutter on "B" and
expose for about 8-32 minutes (IE multiples of one worm rotation).
Time the exposure precisely but do not touch the scope during the exposure.
When you have the film developed you will see that the stars are trailed.
Close inspection will reveal that the trails will have a wavy appearance,
this is PE.
A perfect drive would have straight line star trails. A good drive will
show a smooth sine wave appearance. A poor drive will have many jagged
edges in the star trail.
You can then digitize the image and analyze it, or you can project it on the wall.
I use the GIMP (www.gimp.org) freeware to analyze my star trails.
You will need to know the image scale of your OTA
Use the measuring tool in the GIMP and draw a line from the first
pixel to the last pixel of the star trail. The tool will report the
length in number of pixels and the angle between the first and last
points. Rotate the image in the opposite direction by the same angle.
You will now have a star trail that is completely horizontal. Dividing
the number of pixels in length by the time of the exposure will give
you the number of seconds per pixel and you can then see where each
cycle of the worm begins. Dividing the image scale by the number of
pixels across one dimension of the image will give you the number of
arc seconds per pixel. You find the total PE by finding the position
of the pixels in the star trail closest to the top of the image and
the pixel closest to the bottom of the image. The difference in the
number of pixels between these two points, is the total PE of the
drive. Multiply the this number of pixels by the image scale to give
you the PE in arc seconds. You can examine the trail to see if there
are any sudden vertical shifts in the trail, these represent rapid or
high frequency errors which will be a limiting factor in deciding how
many seconds you can allow between guiding corrections. If your drive
has a smooth sine wave appearance you can calculate the number of
pixels of vertical movement per unit of time which will represent the
longest time that you can guide without correction based upon the
focal length of your OTA.
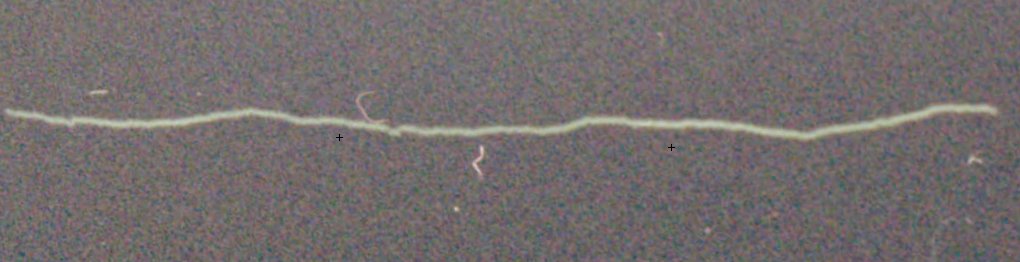
Preliminary CI-700 PE test
image. I know the plate scale
but lost the exact timing. I believe it is only 30 minutes
when I actually wanted 32 minutes.

Click on the image for a high-res version.
stats for CI700 image
3880 pixels = 36mm
36mm = 1.41732in
plate scale = .91 deg/in (1600mm EFL)
plate scale = .1.244 arc sec /pixel
star trail is approximately 30 time minutes duration.
total PE = about 12 pixels or 15 arc seconds over 8 minutes
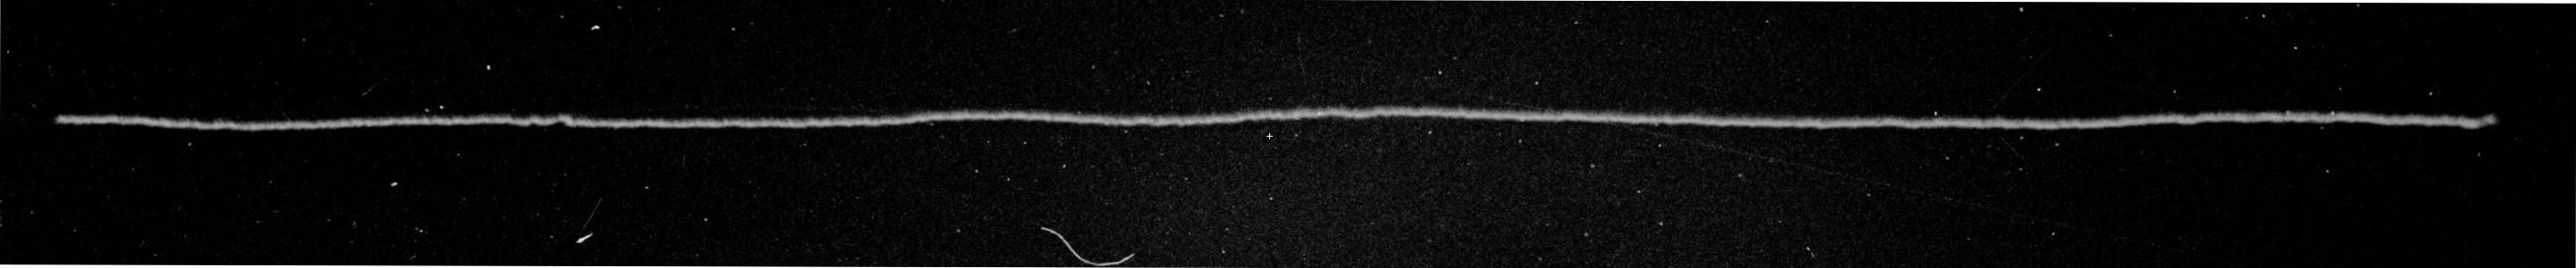
EQ-6 Skyscan PE test image. PE "out of the Box"
click on the image for a high-res version
EQ-6 Skyscan PE test image after cleaning the RA motor and worm spur transfer
gears.
click on the image for a high-res version
Stats for EQ-6 Skyscan image
3880 pix = 36mm
3880 = 1.41732in
plate scale = .57deg inch
pixel =.75 arc/sec
total PE = about 14 pixels or 10.5 arc seconds over 8 minutes
This is an outstanding result for a mount in this price range.
Return to equipment essay page
but lost the exact timing. I believe it is only 30 minutes
when I actually wanted 32 minutes.
Click on the image for a high-res version.
stats for CI700 image
3880 pixels = 36mm
36mm = 1.41732in
plate scale = .91 deg/in (1600mm EFL)
plate scale = .1.244 arc sec /pixel
star trail is approximately 30 time minutes duration.
total PE = about 12 pixels or 15 arc seconds over 8 minutes
EQ-6 Skyscan PE test image. PE "out of the Box"
click on the image for a high-res version
This is a 24 minute exposure.

The image scale is 1.82 arc/sec pixel.

total PE = about 18 arc/sec per 8 minute worm cycle.

2004-11-21
EQ-6 Skyscan PE test image after cleaning the RA motor and worm spur transfer
gears.
click on the image for a high-res version
Stats for EQ-6 Skyscan image
3880 pix = 36mm
3880 = 1.41732in
plate scale = .57deg inch
pixel =.75 arc/sec
total PE = about 14 pixels or 10.5 arc seconds over 8 minutes
This is an outstanding result for a mount in this price range.
Return to equipment essay page