Self-Similarity of the Logistic Function
Logistic, f 3:

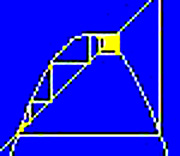
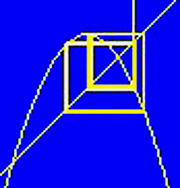
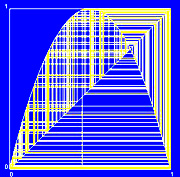
Below are images of f 3 (left) and f (centre) for various values
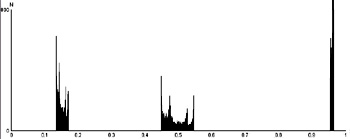
of the parameter a (a value for f 3 / a
value for f ), and the time series for f at this parameter value (right).
The image of f 3 is a portion from the entire graph of
f 3 (as seen above) - in particular, the piece in the middle
near the diagonal line - inverted and enlarged to we can compare it
to the graph of f. (See also Figures 11.30,11.31 pp625,26 in text.)
Period 1 (a = 3.84 / 2.8)


Period 2 (a = 3.848 / 3.3)


Period 4 (a = 3.849 / 3.5)

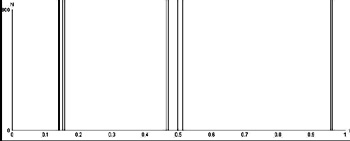
Ergodic (a = 3.857 / 4.0)

All images were produced using the Graphical Iteration applet.