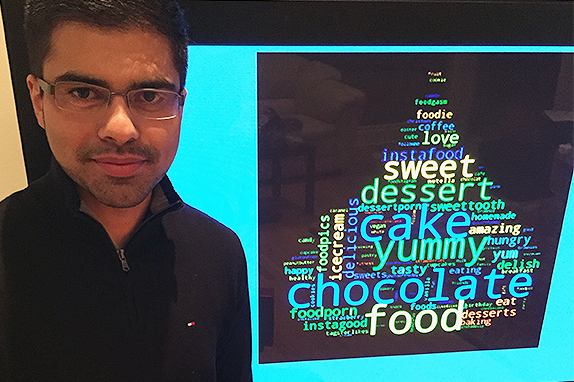
SFU big data student’s Instagram research takes a bite out of #chocolate
When you think about the world’s top chocolate-loving cities, what comes to mind? If it’s Brussels for its famed Belgian chocolates, or Paris for its exquisite candy shops, you might want to think again, says SFU master’s in big data student Saif Charaniya.
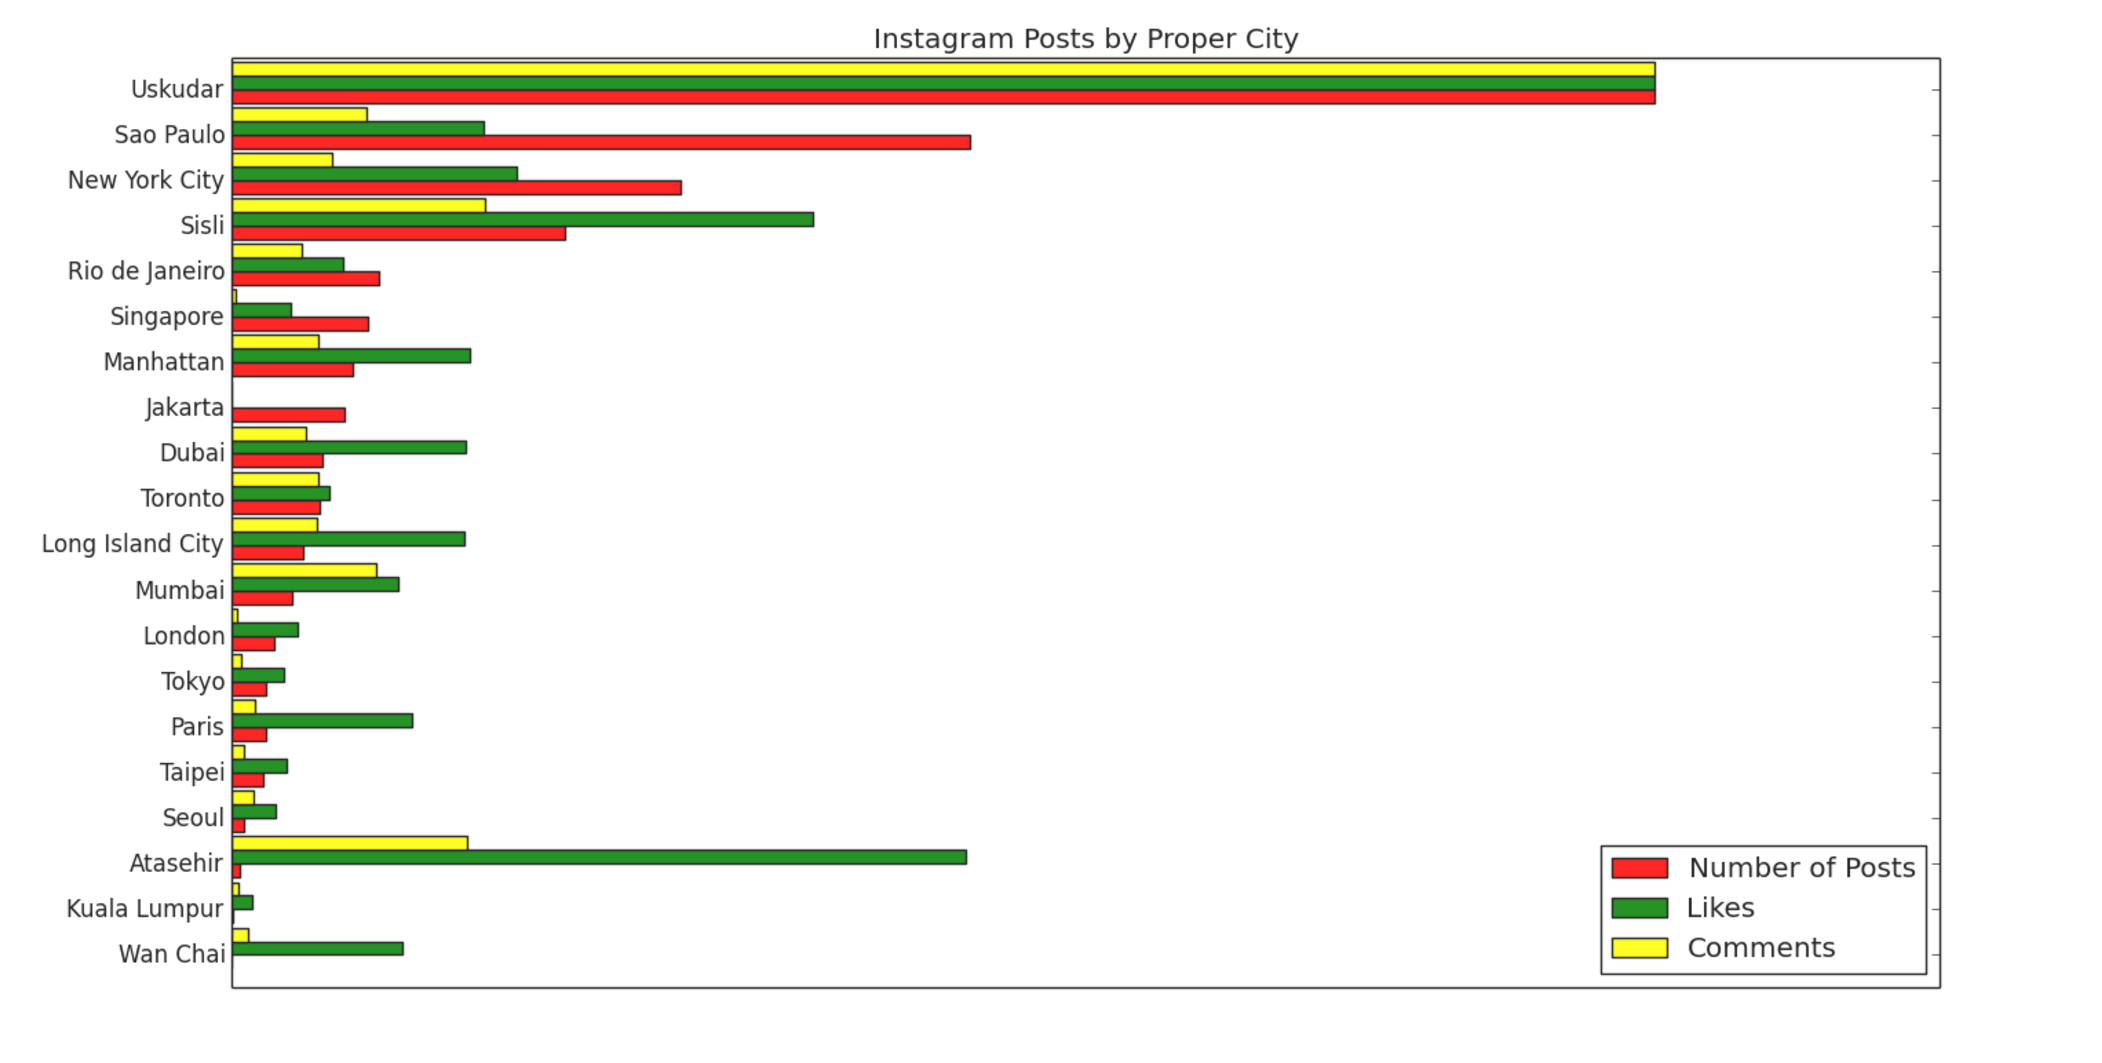
According to Charaniya’s analysis of 1.2 million Instagram posts in a one-year period, the cocoa capital distinction should go to Üsküdar in Instanbul, Turkey.
The dense municipality boasted the highest number of location-tagged posts using the hashtag #chocolate from October 2014 to October 2015 – a total of 228,176 photos.
Charaniya made this unexpected discovery about chocolate, and many more, by using big data techniques to analyze publically available data from the popular image-sharing site.
“Instagram is more than posting a picture; it’s posting a lifestyle,” says Charaniya.
Search for the hashtag #chocolate on Instagram at any time, and you’ll find streams of posts, each loaded with metadata—data that describes other data— about the photo, including location, time, hashtags, likes and comments.
Not only can companies use that data to expand their audiences, it can also provide insights into social and cultural trends around the world.
“Food brings people together, and we also love taking photos of it and sharing this on social media,” he says, referring to the popular Instagram trend playfully known as “food boasting.”
Charaniya found that harnessing and analyzing this data could lead to some interesting findings, especially for companies keen to snatch a share of the $98-billion dollar global chocolate market.
“For example, it can help companies to ascertain the best time to start advertising for holidays in different regions of the world, or to different cultures. You can also correlate posts about chocolate with health statistics, such as obesity rates in a city or country.”
The data can help to tell us where and when products are bought and consumed, or identify trends, such as figuring out how many people in a city prefer chipotle-accented chocolates to classic creamy fudge.
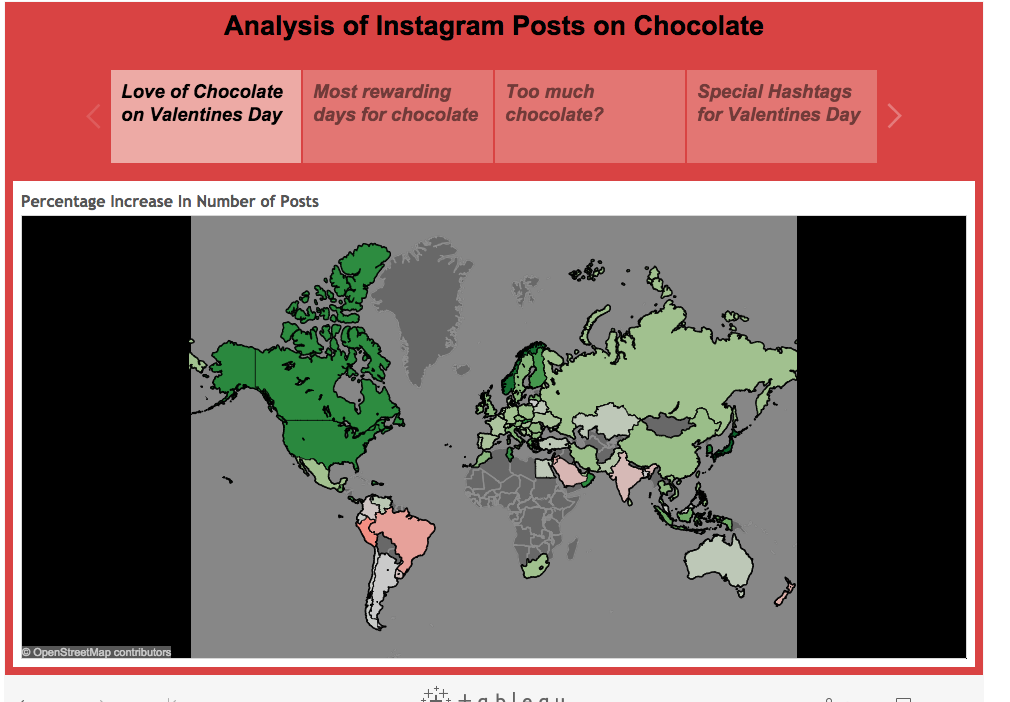
“If you drill down into the data, you can also look at which days different countries like to consume chocolate the most,” says Charaniya. “After all, why would companies spend hundreds of dollars on advertising heart-shaped boxes to Chinese Instagram users in February, when they have a different Valentine’s Day based on the lunar New Year?” He even created a Valentine's-themed storyboard visualization to illustrate his results.
To analyze large amounts of data, from social media or any other source, you first need to know how to process it, and then ask the right questions.
Charaniya collected 40 GB of data over five weeks, making around 5,000 data requests per hour. He collected 9.4 million Instagram posts featuring the hashtag #chocolate, and then refined this to 1.2 million posts that were tagged with a location – a crucial factor for this analysis.
“Then you go through a pruning stage, to pull the data you don’t need: for example in this case, the user names and all the comments,” he says.
“There are so many different types of software to analyze the data, so you have to look at the fastest or more efficient way to get the answers to your questions.”
He then presented his findings using Tableau, a visual analytics software that allows non-technical users to slice and dice the data as desired.
Charaniya received his first introduction to the power of big data during his undergraduate degree in astrophysics at the University of Toronto, where he graduated in 2015.
“Astronomy data is really huge, and we use a lot of big data tools and machine learning to look at telescope data, he says. “My inital goal with the master’s in big data program at SFU was to learn more about those technologies and bring it back to astronomy, but it turns out, I’m actually really interested in applying big data to marketing and social media.”
From the skies to our smartphones, Charaniya’s next goal is to look at sentiment analysis on social media, measuring current public mood by detecting and understanding how an audience is reacting to an event, brand or news story.
Explore more results from Charaniya’s analysis here.