Coordinate Reference:
WGS84 / UTM 10N
Processing:
ESRI ArcGIS, QuantumGIS
WGS84 / UTM 10N
Processing:
ESRI ArcGIS, QuantumGIS
Lief Pagalan, Franz Schug, Tessa Stickney, Gisele Mubalama
This project describes spatiotemporal and socio-demographic patterns of trauma resulting from assaults, or violent trauma, in Metro Vancouver from 2001 to 2008. The insights from this research are valuable in the development of future prevention strategies aimed at reducing the number of violent trauma incidents, the implementation of targeted health interventions at high-risk groups, and the allocation optimization of emergency response resources.
Trauma from assaults are a significant health issue and result in both broader social and economic burdens. The Canadian National Trauma Registry classifies interpersonal assault as intentionally inflicted injuries, and the World Health Organization definition encompasses the broader physical and mental consequences of these assault. In 2014, there were 29,883 police reported assaults in British Columbia, of which 15% were in the City of Vancouver.
Canadian literature on the spatiotemporal analyses of violent trauma found that in Toronto most victims from assault were injured within a 16km radius from their homes, that a relationship exists between victim and injury characteristics to proximal home-injury distances, and that violent trauma incidents peak from 8:00 PM to 4:00 AM at night (Hass et al., 2015). Literature on Metro Vancouver identifies spatiotemporal hotspots of violent trauma (Walker, Schuurman, & Hameed, 2014). These hotspots are characterized by their urban built environment, social deprivation indices, and victim demographics.
Interpersonal violence arises from various behavioural and social conditions, and is a complex phenomenon affected by spatial, temporal, and social factors. This study builds on these findings to further quantify spatial, temporal, and social patterns of violent trauma in Metro Vancouver.
Identify major hotspots of violent trauma in Metro Vancouver and characterize their land use and transit access.
Quantify temporal patterns of violent trauma by month, day of week, and time of day for hotspots and home-injury distances.
Determine whether age, sex, social deprivation indicators, and injury severity, mortality, and mechanism are dependent on hotspots or home-injury distances.
The following results are statistically significant at a 0.05 confidence level, unless otherwise indicated. For more and detailed results, our study is available here.
Statistically significant seasonal effects can be observed across all home-injury distances, with violent trauma incidents peaking on Saturdays and generally from 9:00 PM to 3:00 AM. A similar temporal pattern is observed for hotspots at an aggregate level, but sample sizes were too small to analyze the seasonality and socio-demographics of individual hotspots.
The age of victims of violent trauma incidents differ significantly by home-injury distance. There is a significantly lower proportion of violent trauma incidents for 20–29 year olds within 0–0.35km of their home (3.17% observed, 4.8% expected), but a higher proportion for 20–29 year olds within 20–50km (9.07% observed, 7.16% expected) and for 40–49 year olds within 0.35-2km (3.35% observed, 2.09% expected).
There is a significant difference in the proportions of firearm-related violent trauma incidents across distance, but no significant differences in proportions among assault-, cutting-, and stabbing-related violent trauma incidents. There is a significantly higher proportion of firearm-related violent trauma incidents within a 0–0.35km home-injury distance (4.22% observed, 1.34% expected), but a lower than expected number of assault-related violent trauma incidents (5.37% observed, 7% expected).
Our dataset contains 1271 incidents of trauma resulting from assault in the Metro Vancouver area. Those cases represent the most severe cases of victim injury between 2001 and 2008 and considers victims that have been admitted to hospotal for greater than 48 hours. Data originates from the British Columbia Trauma Registry.
Studies show that space is a relevant factor in researching assault. This includes the design of the urban built environment - i.e. traffic, visibility and light, green spaces, attractiveness, socio-demographic characteristics, access and land use. When comparing a nightlife district featuring alcohol serving facilities versus a residential area with single-family housing there is a different risk to encourage interpersonal violence.
Our hotspot identification method is based on violent trauma density. We enhance it by an experimental watershed analysis, using the metaphor of flow direction to identify local maxima of incidents. Purely quantitative hotspot definition risks conflating adjacent incident peaks together merely due to proximity, even though neighborhood characteristics and underlying assault motivations may differ. Research suggests that hotspot determination is contextual and dependent on environmental and demographic factors as well as subjective perception, too.
In a second step, Getis-Ord G statistics supported further hotspot refinement taking significant differences in socio-economic deprivation within hotspots into account. As a result, Downtown Waterfront and Eastside-Chinatown have been separated along Abbott Street.
Distance from the place of injury to the place of residence is based on a network analysis of the Metro Vancouver road network. Cases have been classified based on a natural breaks algorithm assuring that an equal number of incidents is in each class. Class thresholds have been manually rounded afterwards. We find six classes of home-injury distance: 0–0.35km, 0.35-2km, 2-5km, 5–10km, 10–20km, and 20–50km.
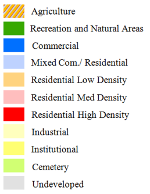
The injury hotspots are areas of high concentration levels of violent trauma incidents. This includes assaults with a knife, gun and battery. The areas, displayed on the map, show the borders and hotspots of where these assaults occur. Our study finds hotspots occurring along major transit routes. Add further information through the layers control panel.
This study finds significant incident peaks in August, on Saturdays and between 9:00 PM and 3:00 AM at night. We see very different patterns on a hotspot level with general trends towards weekends and night time hours. However, limited sample size leads to the fact that only Saturday peaks for Downtown Eastside-Chinatown, Downtown Granville St. and W Hastings-Waterfront are statistically reliable. Eastside-Chinatown also experiences a significant increase around 10:00 PM and 1:00 AM. Other patterns cannot be estimated sufficiently different from random variation.
Across hotspots, patterns of injury characteristics show slight variation. Female injuries tend to be higher in Downtown Eastside-Chinatown, Joyce-Collingwood and Downtown Westend. Considering the mechanism of assault, assault without a weapon and assault by stabbing is predominant across all hotspots. Regarding age, some hotspots show a decreasing number of victims with increasing age and some feature rather equal distributions. In particular, the proportion of people older than 60 varies across hotspots. None of those findings are statistically significant because of the limited case number within most hotspots.
This part of the study works on differences in incident (e.g. mechanism of assault) or victim-related (e.g. age) variables across different classes of home-injury location distance. Literature suggests a link between that distance and the character of the victim or the assault. Our initial hypothesis is that the victim's socio-demographic characteristics is less dependent on home-injury distance than on hotspots.
Again, our study finds significant incident peaks in August, on Saturdays and between 9:00 PM and 3:00 AM at night for the entirety of incidents occurring within the whole Metro Vancouver area (not exclusively hotspots). Monthly peaks vary largely within different distance classes, whereas most of them are not statistically significant. All distance classes except incidents happening at or close to home as well as those happening within 2km and 5km from home significantly peak on Saturdays. The latter has an insignificant trend towards Saturdays, whereas the former class breaks that pattern.
Regarding the intraday level, most distance classes significantly peak between 10:00 PM and 2:00 AM. We cannot make that statement for incidents occurring within 0.35km and 2km from home (insufficient data) and for those occurring at or close to home (peak at 9:00 PM and 3:00 AM only).
For distance classes, we see several trends in the data. The victims are predominantly male whereas, the rate of female victims is slightly higher for incidents that happen at or close to home. The data imposes low mortality rates at the hotspot locations. Those findings are, however, not significantly different across distance classes. Regarding age, most victims are within 20 and 29 years old. There is significantly high number of 20 to 29 year olds being injured at 20km to 50km from home. The expected number is significantly low for injuries at or close to home. Significantly more 40 to 49 year olds are expected to be injured at 0.35km to 2km from home. Considering the mechanism of assault, assault without a weapon and assault by stabbing is predominant across all hotspots. Yet, there is a significantly high number in firearm-related injuries for incidents at or close to home.
This project was developed for the course GEOG 455W Theoretical and Applied GIS, taught at Simon Fraser University by Dr. Nadine Schuurman in Spring 2016. The research was supervised by Blake B. Walker, PhD Candidate in the Department of Geography at SFU.
All images of Metro Vancouver neighbourhoods have been used under the Creative Commons license or labelled for reuse.