Project Methodology:
In order to complete this project,
many steps and many programs were
needed:
Here are the programs that I used
in order to complete my project and
the order in which they were used:
i) Internet Explorer
ii)
PowerArchiver
iii) ArcCatalog
iv) ESRI
ArcMap
v) IDRISI Kilimanjaro vi) Microsoft
Excel
vii)
Notepad
viii) IDRISI
Kilminijaro. ix)
NVU Website Designer.
Internet Explorer:
I used Internet
Explorer in order to find the
data that I needed for my project. I acquired the basemap for my
project from
the Government of B.C. GIS site
(http://srmwww.gov.bc.ca/gis/arcftp.html). The map (which is
under the name abec_bc) came in
.zip
format.
Power Archiver:
I
used the Power Archiver Program in order to unzip
the abec_bc file into .e00 format (ESRI Export File
Format).
ESRI Arc Catalog:
I
used ESRI Arc Catalog in order to convert the abec_bc file into a
coverage, which I then could click and drag into ESRI Arc Map.
ESRI ArcMap:
Here's a summary of the steps:
*1(export data as
shapefile)
*2(Digitize KFD onto layer)
*3(Select by location)
Coverage
---------------> BCGeoclimaticZones --------------------->
BCGeoClimaticZones with KFD Digitized
------------------> BCGeoClimaticZonesSelect
*4(
Create layer from selected location)
*5(Export data as
shapefile)
*6 (Add Fields and Values)
--------------->
Kamloops Forest
District
----------------------------> Kamloops Forest
District
----------------> Kamloops Forest District
Here's
a description of the steps:
*1 (Export data as shapefile) -
*2 (Digitize KFD into layer) - While
looking at a BCAA Map of British Columbia and a Kamloops Forest
District Handbook of the Kamloops Forest District,
I digitized an approximation of the Kamloops Forest District onto the
BCGeoclimatic Zones file using the editor
toolbar and saved the changes onto the .shp file.
*3 (Select by Location) - In
order to narrow the BCGeoClimaticZones shapefile into the zones inside
the Kamloops Forest District, I used the select by location function in
order to 'select all areas that are within a distance of 5 km of the
Kamloops Forest District'.
*4 (Create layer from selected
location) - This created a layer from the current selection of
zones within 5 km of the Kamloops Forest District. (Kamloops
Forest District.lyr created)
*5 (Export data as shapefile)
*6 (Add Fields and
Values) - I did using the 'add field' function in the attribute
table. I added five fields in total:
a) Average annual
precipitation b)
July Max Temperature c)
January Minimum Temperature Kelvin
d) Frost-Free Periods in
Days e) Growing
Degree Days.
This was accomplished using
the 'select by attributes'
feature and then
'select by zone' and 'select by
subzone'. When I was in the 'selected'
view of the attribute
table, I added values to the
each field for that particular
subzone.
IDRISI
Kilimanjaro:
*1: Imported .shp file into IDRISI
vector format + created blank raster file from ìnitial
module. This blank raster file was used in combination with the
Kamloops Forest District Vector file in order to create the
tristanraster kamloops raster file
*2:

Microsoft Excel:
I
opened the kamloopsforestdistrict.mdb file in excel format and saved it
in .xls format. Then,
I added several new fields (representing expected climatic values in
2050) to it and calculated their values.
i) Precip
2050 ii)
July2050 iii) JanKelvin
2050
iv) FFP 2050 v)GDD 2050
i) Precip 2050 = Average Annual
Precip +0.10*(Average Annual Precip)
ii) July 2050 = July Max
Temperature + 1
iii) JanKelvin 2050 = January
Minimum Temperature Kelvin +
3.
iv) FFP 2050 = FFP + 30
v) GDD2050 = GDD + (0.25*GDD)
Then, knowing that I needed to be
able to do analysis on each field in IDRISI Kilimanjaro, I created a
series of .csv files which only consisted of two fields (the IDR (used
as the 'primary key' in raster) and the climatic variable of relevance
(e.g. JulyMaxTemp))
(e.g.
IDR JulyMaxTemp)
200 30
I did this for each field and saved each one as a .csv file (e.g.
JulyMaxTemp.csv)
Notepad:
I opened each .csv file in
Notepad. In Notepad, I used the 'replace , with space' function
in order to get the data in a 'IDRISI' friendly format. Following
this,
I saved each .csv file as a text file (e.g. JulyMaxTemp.txt).
IDRISI Kilimanjaro:
*1: Opened up each .txt file for climate attributes and saved them as
.avl files.
*2: Assigning, Reclassing for Present Values.

*3: Assigning, Reclassing for Future Values

*4: Apple-Growing Suitability at Present:

*5: Apple-Growing Suitability in 2050:

*6: Grape-Growing Suitability at Present:
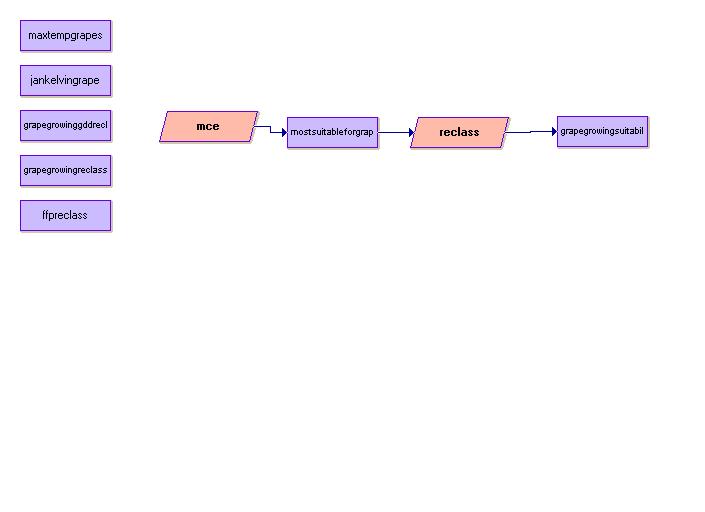
*7: Grape-Growing Suitability in Future:

*8: Spatial Inquiries for:
i) Grape-Growing Area Present vs 2050 (Produced Grapes 2050 but not
today.rst and Produced
Grapes Today But Not 2050.rst)
ii) Apple-Growing Area Present vs 2050 (Produced Apple 2050 but not
Present.rst and Produced Apples Today but not 2050.rst)
iii) Apple-Growing Area Present vs Grape-Growing Area Present
( Produced Applesbutnot Grapes.rst and Grapesbutnot Apples.rst)
iv) Apple-Growing Area 2050 vs Grape-Growing Area 2050
(Produced Apples but not grapes 2050.rst and Grapes but not Apples
2050.rst)
v) Apple and Grape Growing Area present vs Apple and Grape-Growing Area
2050:
(Produced agpresent but not 2050.rst and ag present but not 2050.rst)

backtoindex