
 The majority of spatial data used in this project were acquired from the "City of Vancouver" folder in the Data Warehouse of the "S Drive" of Simon Fraser University.
Additional spatial data was taken from the "Translink" folder on the same drive.
Statistics for automobile accidents and motorvehicle thefts were taken from the Planning and Research deparment of the Vancouver Police. Spatial Data were then all converted into IDRISI Raster format while the statistics were entered manually in IDRISI. Steps for these conversion processes will be shown below.
This original data is as follows:
| Name | Description | File Format |
Date |
|---|---|---|---|
dotareas |
City of Vancouver with Neighborhood divisions (Polygons) |
.shp |
Jan 2001 |
mainstreets/sidestreets |
Streets of Vancouver (Lines) |
.shp |
Jan 2001 |
parks |
Parks in the City of Vancouver (Polygons) |
.shp |
Jan 2001 |
busexchange |
Bus Exchanges for the GVRD (Points) |
.shp |
Oct 2002 |
Sept_2001_All_Routes |
Bus Routes for the GVRD (Lines) |
.shp |
2001 |
Skytrain Stations |
Skytrain stations in the entire transit system (Points) |
.shp |
Oct 2002 |
Statistical Reports (By Neighborhood) |
Vancouver Police Statistics on crime, compiled by month and by neighborhood |
.pdf |
Jan-Sept 2006 |
 All spatial data were converted in the following sequence:
1. "Feature to Raster" function was used. This can be found in Arc Toolbox under conversion tools. (shown on the left)
2. All cell sizes were converted to 50m resolution Each cell was assigned a single attribute as is neccessary with raster data.
3. All newly converted raster files were then converted to the ASCII format in Arc Toolbox (shown on the right).
4. Data were then imported into IDRISI. It was imported as ArcInfo ASCII format and then converted into IDRISI raster form using the Plane reference system.
The statistical reports published by the Vancouver Police department, the non-spatial data portion of my project, had to be manually entered. The .pdf nature of the files meant that numbers had to be manually taken from one file format to another without any sort of automated conversion process. Statistics extracted included Neighborhood names, number of motorvehicle thefts by month and number of traffic accidents by month. This is shown in the following:

For a more generalized average, all statistics available for 2006 (Jan - September) were compiled in excel to produce a total number for each neighborhood. The chart for motorvehicle thefts is shown below:
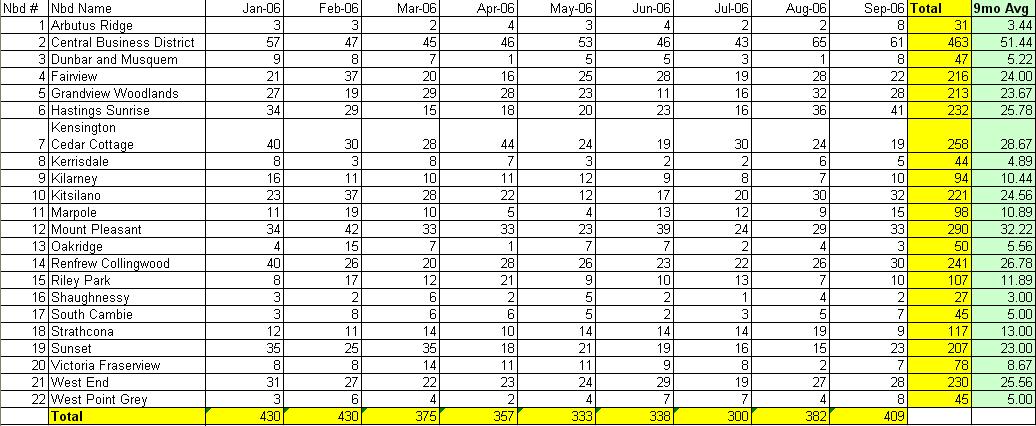
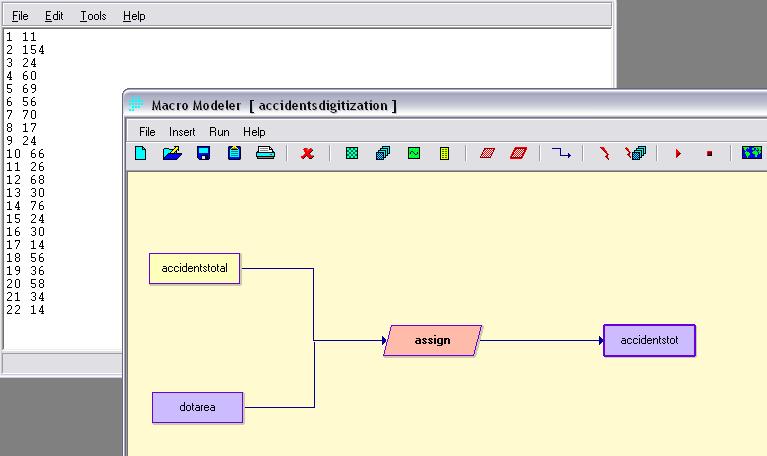
For organizational purposes, each neighborhood was assigned a unique numerical value between 1 and 22 (as shown below) and were later assigned the statistics for motorvehicle thefts and vehicle accidents (two separate raster files). This was done using the ASSIGN module and an Attribute Values File (shown below):

All data needed to have the same resolution, projection and coverage area. The first two factors, resolution and projection were taken care of in the conversion processes: 50m cell resolution and plane projection. Data had the following characteristics that needed to be rectified using the Window and Concatenation modules:
1) Different layers (i.e. Busroutes) were larger and covered more area than others (City of Vancouver Parks). This was rectified using the Window module, which clipped areas according to a base image, which in this case was dotareas. However...
2) Some layers did not extend fully across the area of study. For example: The skytrain line extends to a certain extent of the City of Vancouver but is not present for much of the western area of Vancouver (shown below). This resulted in an error in the Window module which stated "Window extends beyond image limits". This problem was solved using the Concatenation module. First the dotareas file was reclassified to make it completely blank (all values were 0). This would be concatenated with images that originally extended past the Window.

Left: In this case the red square represents the area covered by the vancouver parks raster file (coverage similar to dotareas file) while the yellow outline represents the area covered by the skytrain station raster file.
Because the window image extends beyond the Skytrain layer, a Window operation would not have been possible.
Concatenation would have extended the coverage area of the skytrain by adding area to the west. These data, because they were all 0 data values had no affect on the representation of the skytrain station layer since it does not extend that far west.
With all data converted and standardized, it is now possible to conduct meaningful and correct analyses and we can move on to the Methodology of the project or return to the Top of the Page.
