Introduction
Choropleth vs. Dasymetric
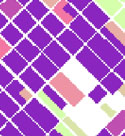
 Choropleth maps are traditionally used to map socioeconomic variables, such as population density or other types of census data. Enumeration areas are the most common mapping units for choropleth as they make up the smallest polygons. There are three (Langford & Unwin, 1994) significant problems associated with choropleth maps that must be addressed. First, the enumeration areas are arbitrarily determined for data collection convenience (ie. for the convenience of census data collectors), subsequently creating large polygons for regions where the population density is low and small polygons for regions where there is high population density. Second, the enumeration areas act as low-pass filters, generalizing the highs and the lows and removing the spatial specialization. Because boundaries are arbitrary, they will not convey any significance to the data, therefore attention is paid towards the size of the polygons rather than on the data conveyed. Lastly, enumeration areas do not differentiate physiographic entities such as parks, lakes, streams, roads, forested and agricultural areas. Consequently, this is incorrect as these areas are populated. Choropleth maps are traditionally used to map socioeconomic variables, such as population density or other types of census data. Enumeration areas are the most common mapping units for choropleth as they make up the smallest polygons. There are three (Langford & Unwin, 1994) significant problems associated with choropleth maps that must be addressed. First, the enumeration areas are arbitrarily determined for data collection convenience (ie. for the convenience of census data collectors), subsequently creating large polygons for regions where the population density is low and small polygons for regions where there is high population density. Second, the enumeration areas act as low-pass filters, generalizing the highs and the lows and removing the spatial specialization. Because boundaries are arbitrary, they will not convey any significance to the data, therefore attention is paid towards the size of the polygons rather than on the data conveyed. Lastly, enumeration areas do not differentiate physiographic entities such as parks, lakes, streams, roads, forested and agricultural areas. Consequently, this is incorrect as these areas are populated.
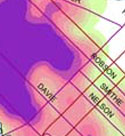
Choropleths are extremely popular, despite their limited ability to convey socioeconomic data as they are a standard map option in GIS software, and work well as a preliminary visualizing tool. Typically, darker shades show a higher degree of variability and vice versa. The discrete mapping units (i.e. enumeration areas), however, do not accurately represent population density. Similar to temperature and elevation, population is continuous data. Choropleth maps suggest uniformity within the polygon and abrupt boundaries; we know this does not reflect reality. Population densities are best represented over a continuous surface without delineated boundaries.
 Dasymetric mapping attempts to correct the flaws of choropleth mapping. This approach can fairly accurately portray the true nature of surface variations better than the polygon overlays of choropleth by adding additional geographical information such as road networks or remotely sensed data. For example, overlaying air photos with the enumeration areas will partially determine where there are unpopulated areas which should, therefore, be removed from the total land area used to calculate population density. Yuan et al (1997) suggests that errors will be made with each step of the dasymetric process but they can be corrected with more data. Langford and Unwin (1994) suggest that “the discontinuities shown on the dasymetric map are more likely to be realistic guides to the genuine underlying distribution of the property that is being mapped” (23). Dasymetric mapping attempts to correct the flaws of choropleth mapping. This approach can fairly accurately portray the true nature of surface variations better than the polygon overlays of choropleth by adding additional geographical information such as road networks or remotely sensed data. For example, overlaying air photos with the enumeration areas will partially determine where there are unpopulated areas which should, therefore, be removed from the total land area used to calculate population density. Yuan et al (1997) suggests that errors will be made with each step of the dasymetric process but they can be corrected with more data. Langford and Unwin (1994) suggest that “the discontinuities shown on the dasymetric map are more likely to be realistic guides to the genuine underlying distribution of the property that is being mapped” (23).
Introduction: Background . Objectives . Choropleth vs. Dasymetric
next ► Methodology
|
|