Creating an Interactive Google Maps API Mashup for the Hastings Crossing Business Improvement Association
Objective: The objective of this project is to create an interactive map that will help raise awareness of the businesses, services, history and culture located within the relatively new Hastings Crossing Business Improvement Association (HxBIA). The map will be created using Google Maps API, which allows the basic functionality of Google Maps and can be embedded onto the HxBIA website free of charge.
Purpose: Geography 455 Final Project Website created for HxBIA under the direction of Wesley Regan (Executive Director, HxBIA).
Acknowledgements: Dr. Nadine Schuurman, Fiona Lawson and Wesley Regan
The Team:
- Leona Christie
- Maziar Kazemi
- Sarah Verkaik
- Adam Lee
- Stefan Timotic
Contact:
Throughout our site we feature photographs taken from within the Hastings Crossing BIA such as this one bellow of a women leaning out a window which was featured in a calendar called Hope In Shadows based around a photography contest for low-income community members of Vancouver's Downtown Eastside.
. Retrieved February 17, 2012, from http://www.hxbia.com/Hope in the Shadows.")
A Brief History of the Downtown Eastside (DTES)
Covering an area of approximately 200 hectares and a population of 16590 in 2001, the DTES is the oldest district of Vancouver and was the commercial hub of Vancouver in the first half of the 20th century. Both social and physical character shape the areas past. The DTES is comprised of visible minorities and a high proportion of Aboriginal people and has historically contained a large low-income population. Alongside port-related distribution and processing industries, a healthy entertainment and retail sector was prevalent in the area up until the 1970s. Deindustrialization and disinvestment in the area undermined the economic viability of the area in contrast to the rest of East Vancouver. Asian investments into the city in the 1980s and 1990s seemed to have bypassed the DTES altogether. Both the suburbanization of shopping and the creation of large shopping malls in the downtown core in the 1980s precipitated the collapse of the DTES retail thoroughfare along Hastings Street. The collapse of the DTES retail thoroughfare had enduring effects on the area. In 2003, 33% of storefronts along Hastings Street remained vacant suggesting that DTES retail never revitalized. Among the surviving storefronts remain retail activity centred around pawnshops, convenience stores, and fast-food outlets - some involved in illegal activities (Mason, 2007).
. Spacing Vancouver. Retrieved February 12, 2012, from Price Points: An Interesting Street: http://spacingvancouver.ca/2011/10/24/price-points-an-interesting-street/")
Pigeon Park is Vancouver's smallest park and is a popular Downtown Eastside gathering place.
What is a Business Improvement Association?
Business improvement and the revitalization of city neighbourhoods in decline are becoming increasingly more common due to the institutionalization of non-profit Business Improvement Associations (BIAs), which provide services that were once under the provision of the municipal government. The key problem faced by BIAs is their ability to promote the community in such a fashion that meets the benchmarks that they first set out to achieve. For many BIAs this includes promoting businesses, attracting consumers to the area, and increasing the amount of visitors to the community.
A Business Improvement Association (BIA) is a voluntary association of local businesses and are a form of public-private partnership uncommon with sole municipal representation , which volunteer to levy a "tax" upon them in order to improve the local area and acts as a supplement to the money already spent by the public sector (Steel & Symes, 2005). They may be seen to be replacing municipal government to an extent, by providing the conditions for collective action previously only available at the municipal level (Lloyd, Mccarthy, Mcgreal, & Berry, 2003, p. 300; Schaller & Gabriella, 2005). Some BIAs chose to include a website providing street maps alongside information on parking locations and contact numbers for local businesses (Steel & Symes, 2005, p. 325). Some BIAs are more ambitious and their websites are used to advertise job vacancies; some even specifying which jobs may be suitable for disabled applicants, and other community specific features (Steel & Symes, 2005, p. 325).
The advantages of BIAs are acting as a first point of contact for those seeking information on investing in the area and maintaining the effort of the BIA in terms of communicating advancements and success in the form of results as to maintain enthusiasm and commitment amongst owners and businesses (Lloyd, Mccarthy, Mcgreal, & Berry, 2003). The rapid rate of expansion strongly suggests that they are fulfilling the desired needs and expectations of their members, although other groups (i.e., local citizen groups) are sometimes hostile to such programmes claiming that they are wholly aimed at serving the agendas of local business groups and not the wider community (Lloyd, Mccarthy, Mcgreal, & Berry, 2003).
. Retrieved February 12, 2012, from Bridge and Tunnel Club: http://www.bridgeandtunnelclub.com/bigmap/outoftown/canada/britishcolumbia/vancouver/downtowneastside/index.htm")
The Balmoral Hotel built in 1912, was at the time a type of high-class establishment accommodating commercial businessmen and wealthy travellers.
Why Create a Map?
Mapping the community has been observed as an integral responsibility of the BIA. A review of all BIAs in the Metro Vancouver area shows that the most effective maps are those that are both interactive and offer functionality already familiar to the user (i.e., Google Maps Mashups), while the least effective maps were static or non-existent. As the main method of communication to the wider community is via the web, BIAs are increasingly resorting to the various new tools and methods to enhance static maps and introduce multiple layering, interactivity, and multimedia. Although there is no standard numerical measure of the success of BIAs, their rapid rate of growth suggests that they fulfill the needs and expectations of their membership, although other groups may sometimes be hostile to such initiatives, claiming that they are wholly aimed at serving the agendas of local business groups and not the wider needs of the community.
The following table demonstrates:
- 22 BIAs in the City of Vancouver (Hastings Crossing and West Broadway are the newest and were not included in calculations)
- Of 20 established BIAs, 12 have some type of map
- Of the 12 maps, seven were interactive (one did not work)
- 5 used Google Maps API
| BIA Name | Map Type | Website | Comments |
|---|---|---|---|
| Cambie Village | No maps | http://www.cambievillage.com | - |
| China Town | Interactive map - Google Maps API | http://www.vancouver-chinatown.com | Click on business, pop-up appears on Google Maps. No combined map of all businesses |
| Collingwood | No maps | http://www.shopcollingwood.ca/ | - |
| Commercial Drive | Interactive Business location map | http://www.thedrive.ca | Click on a business and it scrolls and highlights the building where it is located |
| Downtown | Interactive map | https://netforum.avectra.com/eWeb/ StartPage.aspx?Site=DVBIA | Historical/general information about buildings in Downtown |
| Dunbar | Interactive map | http://www.dunbarvillage.ca/ | Interactive map would not load |
| South Hill (Fraser Street) | Interactive Map - Google Maps API | http://southhillbia.ca/ | Points for each business that can be clicked, can be narrowed by category |
| Gastown | No maps | http://www.gastown.org/ | Only map is an image of where the BIA headquarters are located |
| Hastings Crossing | General Area Map - being upgraded interactive map using a Google Maps API | http://www.hxbia.com | Our group has created a new and improved map for this BIA. |
| Hastings Sunrise | No maps | http://www.hastingssunrise.ca/ | - |
| Kerrisdale Village | No maps | http://www.kerrisdalevillage.com/ | - |
| Marpole | No maps | http://www.marpoleonline.com/ | - |
| Mount Pleasant | General area map | http://mountpleasantbia.com | No businesses are included in the map |
| Point Grey | General area map | http://www.pointgreyvillage.com/ | - |
| Robson Street | Uses a form of Google Maps API, but is not interactive | http://www.robsonstreet.ca/ | No combined map of businesses, map is found by clicking on each business separately |
| South Granville | Non-interactive map | http://www.southgranville.org/ | Two maps - one for merchants and another for galleries. |
| Strathcona | PDF area map | http://www.strathconabia.com/ | No business information included on map |
| Victoria Drive | Interactive Map - Google Maps API | http://www.victoriadrivebia.com | Displayed by category type or by all. Some information (such as contact) still needs to be filled in. |
| West Broadway | n/a | http://westbroadwaybia.com/ | Site under construction |
| West End | No maps | http://www.westendbia.com/ | - |
| West 4th | Interactive maps - Google Maps API | http://www.shopwest4th.com/ | Point maps for fashion, restaurants, outdoor & lifestyle and home & specialty, which can be broken down into varying categories |
| Yaletown | No maps | http://yaletowninfo.com/directory/ | - |
An example of a good interactive map is given by the West 4th BIA , as maps seem very helpful and informative. The maps can be broken down into different categories easily, by type of cuisine or shop or by a broader category (Kitsilano 4th Avenue Business Association, 2011). The interactions with this website are easy and it promotes visitors to shop, stop and eat within the West 4th area.
The current map on the Hastings Crossing BIA website, as seen below, leaves a lot to be desired. This static map lacks any of the vital information needed about businesses and other important aspects of this historical and diverse neighbourhood. A vastly improved and more informative map was needed to provide the necessary information that visitors may need before going to Hastings Crossing BIA.
. Retrieved February 17, 2012, from City of Vancouver: Community Services: http://vancouver.ca/commsvcs/cityplans/bia/map.htm")
Maps are:
- More eye-catching that a wall of text. Reading through walls of texts makes information more difficult to find and takes a much longer period of time.
- Provide spatial context. It is harder to distinguish one place from another through text. On a map, the location of a place relative to another can easily be seen
- Provide an intuitive way for data to be indexed, accessed, mined and understood.
- Enhance or supplement textual information. (Boulos, Web GIS in practice: an interactive geographical interface to English Primary Care Trust performance ratings for 2003 and 2004, 2004).
- Maps are very valuable tools that can have transformative power and potential and shape our perception of a place (Lydon, 2002).
- Can be tools that help empower local citizens and bring planning to a more local level. (Lydon, 2002)
Why an interactive web map?
Interactive mapping has grown greatly with the development of Web 2.0, as the internet allows for real-time information to be shared by a wide-range of users. The technologies involved with interactive mapping have also become easier to use and popular (Highfield, Arthasamprasit, Ottenweller, & Dasprez, 2011). Paper and static maps become obsolete fairly quickly (Kobayashi, Fujioka, Tanaka, Inoue, Niho, & Miyoshi, 2010). Interactive maps provide an improved service for its users, and with the adoption of new online geographic interfaces, such as Google Maps, they are now easier to create and use than ever before.
Google Maps has transformed our ability to reference and view geographically referenced data in such that it is capable of enhancing static maps and introducing multiple layering, interactivity and multimedia (Gibin, Alex, Richard, Pablo, & Paul, 2008, p. 85). In June 2005, Google officially released their Google Maps Application Programming Interface (API), which enables users to mix Google streamed base data with other spatially referenced material. These data are then able be presented through the Google map interface. The Google Maps API is essentially a collection of JavaScript classes that can be called from a web page in order to build various elements of an interactive map. Other more automated ways exist for users to create and share maps, such as Google My Maps, but the creation of mashups requires users to possess some knowledge of JavaScript, XML (Extensible Markup Language), Ajax (Asynchronous JavaScript and XML), XHTML, CSS and VML. The lattermost two of these create the web page layout for the map mashup application ( Gibin, Alex, Richard, Pablo, & Paul, 2008, p. 86).
Reasons to use Google Maps API:
- Can be embedded on your own website. This allowed us to create a map for the Hastings Crossing Website (view)
- Recognizable and Popular. Many people are already familiar with the Google Maps platform, as it is well-known mainstream map tool and widely used due to its functionality and ease of use (Highfield, Arthasamprasit, Ottenweller, & Dasprez, 2011). This makes interactions with the map easy for both experienced and new users to figure out.
- Interactive. Google Maps API allows users to zoom in and out and switch between the traditional map view and the satellite view. Different types of interactions can also be added by a programmer, such as various levels of multimedia and geographical data layers.
- Enhanced Experience. Google Maps API allows for visitor’s experience to be enhanced, allows visitors to discovered new places online. It is a "fantastic way to enhance the customer experience" (Websites: What interactive mapping has done for us, 2011).
- Google Maps Street View. You can "check out a restaurant before going there, find beautiful places around the world to visit on your next vacation, or check out neighborhoods when you’re looking to move" (Google, 2012). Street View will allow for our users to check out Hastings Crossing in the manner they originally intended to interact with the Hastings Crossing area
- Free to use on your own website. Google Maps API is free as long as they receive less than 25,000 views a day, which we definitely do not expect to exceed. While Google Maps API’s geographical information is not guaranteed, but a commercial GIS system could cost between 1,000 and 10,000 USD for guaranteed geographical information. Since the accuracy of the data presented in our map is not crucial, the free option is perfectly suitable and we do not expect any troubles.
- Compatible. Google Maps API is highly compatible, and works in all browser types (such as Internet Explorer, Safari, Google Chrome, and Mozilla Firefox) without any third-party plug-ins (Highfield, Arthasamprasit, Ottenweller, & Dasprez, 2011). Google Maps also work on mobile devices than run on the Apple iOS or Android platforms.
- Customizable. Programmers can create applications that read and write from the Google Service, and since it is widely used, there are many people who know how to use these tools. The applications made by programmers can be seamlessly imputed into the interface, unnoticeable to the user (Highfield, Arthasamprasit, Ottenweller, & Dasprez, 2011). P rogrammers can access different pre-built functionalities or classes, and create their own applications by using classes to perform operations using their external data ( Gibin, Alex, Richard, Pablo, & Paul, 2008, p. 86). This allowed us to customize our maps in the way that best suited our needs. This also allows for future editing.
The data we use throughout our project with the Hastings Crossing BIA vary tremendously from layer to layer in how the data is obtained, how the data is used, and what the data represents. Data varied depending on which layer we were working on (Business, Parks and Recreation, or Cultural Sites)
Business Layer
In the business layer, a majority of the data was obtained through the Hastings Crossing BIA, which subsequently obtained the data from the City of Vancouver. The data was in a spreadsheet file and contained each business as well as the address, postal code, land coordinates, unit number, license type, and a mailing address. Data was complex and had to be organized to accommodate for (1) a single building possessing more than one address due to the building facing multiple directions and (2) a building possessing multiple units. Missing data such as websites were obtained through manual searches of each business on the internet to obtain the website and the phone number. A blank space was left for the businesses that did not have a website or a website that we could not find. Making spaces blank will allow for developers in the future to easily identify and modify the spaces with updated information.
Sources: HxBIA, City of Vancouver, Official Web-Sites of businesses
Parks and Recreation
There are currently only four parks are located in the Hastings BIA, however two of these are official and two are informal. The two informal green areas are the homeless soccer turf and community garden. They were more challenging to obtain data for as they are not listed on popular mapping sites such as Bing, or Google Maps. They are also relatively new to the Hastings Crossing BIA. Therefore a different approach was necessary to deal with the informal features. User driven websites such as internet blogs and Wikipedia offer up to date information better than official websites. The success of using informal websites for information was successful. To further validate, a ground-truth of the sites was required. The parks layer is one of the more dynamic areas to map because of its inherent informality in the Hastings Crossing BIA urban environment. Each part is also accompanied by a brief description as well as any amenities it may provide such as washrooms.
Sources: Wikipedia, www.streetsoccercanada.org , www.cityfarmer.info
Cultural Sites
The cultural layer was developed through the aid of research (internet and otherwise) to make users aware of the history of the Hastings Crossing BIA (much like the Parks and Recreational layer). The most reliable sources were government websites dedicated to tourism. The layer has seven features with an attribute table that gives the name, address, and background information on the site providing the user with the historical significance of the building. The cultural layer had challenges related to scale. One challenge within gathering the data was subjectively determining (with the aid of the HxBIA) which buildings should be deemed significant. Almost every building in the area has some kind of history that spans back to the founding of Vancouver. With internet website research, as well as government websites dedicated to tourism development, we were able to pinpoint the most significant historical buildings. This culminated into seven different buildings located throughout the Hastings BIA. Another problem of the cultural sites related to the interactive map was classification - especially with the victory square polygon feature. It is a historic site, dedicated to war veterans, but it is a park. Ultimately, we classified it as a park but added a historical description in the text box. The cultural layer had its own unique challenges in the form of scale and classification that were dealt with by educated decision making and technical experience.
Sources: Wikipedia, Official Web-sites of cultural buildings
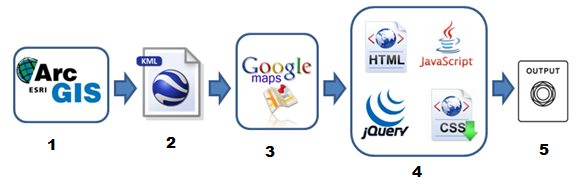
1. Create and edit layers using ESRI's ArcGIS 10
- The addresses from the business layer were manually geocoded and the joined via the address field of the corresponding building footprint polygon shapefile.
- Polygons were created for each layer to represent buildings, parks and other areas as individual objects. Each polygon in a layer was given a unique text identifier via a field in the layer's attribute table. The unique text identifier corresponds to the name of an HTML file containing polygon specific data in a table format. ArcGIS's URL pop-up option allowed for a link to the location of the HTML file to be given to each polygon.
2. Convert from shapefile to KML file
- All shapefile layers were converted to Keyhole Markup Language (KML) file format, an eXtensible Markup Language (XML) notation used to express and visualize geospatial data within internet-based maps
3. Overlay layers on a Google Map
- All KML layers were overlaid on a Google Map using Google Maps API and pinpointed to Hxbia's exact location using Longitude/Latitude coordinates.
4. Manipulate and Style Data
- Functionality of the map features was written using the scripting language JavaScript and the cross-browser JavaScript library jQuery.
- Styling of the data tables was done using Cascading Style Sheets (CSS)
5. View Output
- KML layers may be turned on/off with the use of a checkbox function
- When a user clicks on a polygon, the URL referencing the HTML data table is extracted from the polygon object and that corresponding HTML data table is injected into the user's page.
The interactive map can be viewed here
Bellow is a photograph of Save-On-Meats, the location of our first team meeting.
. Save-on Meats Coffee Shop (Diner). Retrieved February 12, 2012, from Blog: Follow me foodie : http://www.followmefoodie.com/2011/08/save-on-meats-coffee-shop-diner/")
Time Constrants
The total time frame for the project was under three months in length and did not allow enough time to be allocated to becoming well acquainted with the area and objectives of HxBIA prior to beginning to work on the map. With extra time the team would have strived to have a greater presence within the DTES community and would use primary data sources as opposed to secondary data.
Map Maintenance
Post completion updates may be difficult to do given the constant updating that are anticipated due to the formal and informal development of the HxBIA area. It is difficult for non-experts to make wise map updating decisions due to inexperience. Alternately, information on the map would be presented differently than how locals would have preferred.
Local Community Knowledge
It can be argued that our map did not contain or consult enough local knowledge and that it took too much of a conventional GIS approach because attributes of locations were presented via the website rather than various ways that the community interact with the built environment (i.e., informal areas of interest not presented on the map).
. Contact. Retrieved March 25, 2012, from Living Oceans Society: http://www.livingoceans.org/sites/default/files/images/dominion_bldg.jpg")
Build in 1910, the 13-storey Dominion Building was the tallest commercial building in the British Empire upon its completion.
Suggestions for Future Work
- Involve the community in future mapping projects through focus groups and surveys of willing locals to best incorporate their knowledge and familiarity with the area.
- Features we suggest adding during Phase Two of the HxBIA website improvement project:
- Incorporate VGIS features in the map via Google Maps API or through other interfaces
. Retrieved February 12, 2012, from CitiFund: http://citifund.com/sites/default/files/condo_concrete_-_woodwards.jpg.crop_display.jpg")
The original portion of the Woodwards building was constructed in 1903 as a department store. The "W" sign at the top of the building is a distinctive landmark on the Vancouver skyline.
- Gibin, M., Alex, S., Richard, M., Pablo, M., & Paul, L. (2008). An Exploratory Cartographic Visualisation of London through the Google Maps API. Appl. Spatial Analysis , 1, 85-97.
- Highfield, L., Arthasamprasit, J., Ottenweller, C. A., & Dasprez, A. (2011). Interactiveweb-based mapping: bridging technology and data for health. Internation Journal of Health Geographics, 10(69), 1-13.
- Kobayashi, S., Fujioka, T., Tanaka, Y., Inoue, M., Niho, Y., & Miyoshi, A. (2010). A Geographical Information System Using the Google Map API for Guidance to Referral Hospitals. J Med Syst, 34, 1157-1160.
- Lloyd, M., Mccarthy, J., Mcgreal, S., & Berry, J. (2003). Business Improvement Districts, Planning and Urban Regeneration. International Planning Studies, 8(4),295-321.
- Lydon, M. (2002). Thesis: (Re)Presenting the Living Landscape: Exploring Community Mapping as a Tool for Transformative Learning and Planning. Victoria:University of Victoria.
- Mason, M. (2007). Collaborative partnerships for urban development: a study of the Vancouver Agreement. Environment and Planning A, 39, 2366-2382
- Steel, M., & Symes, M. (2005). The Privatisation of Public Space? The American Experience of Business Improvement Districts and their Relationship to LocalGovernance. Local Government Studies, 31(3), 321-334.