To explore some of the causal factors and relationships affecting the regions ability to achieve LRSP objectives, a more detailed analyses is conducted of land-use and transportation patterns of the two largest and fastest growing municipalities in the region: Vancouver, one of the most sustainable municipalities in the region and Surrey, one of the least, to explore how factors such as residential and commercial densities, and the degree to which these land-uses are mixed, affects transportation patterns and outcomes.
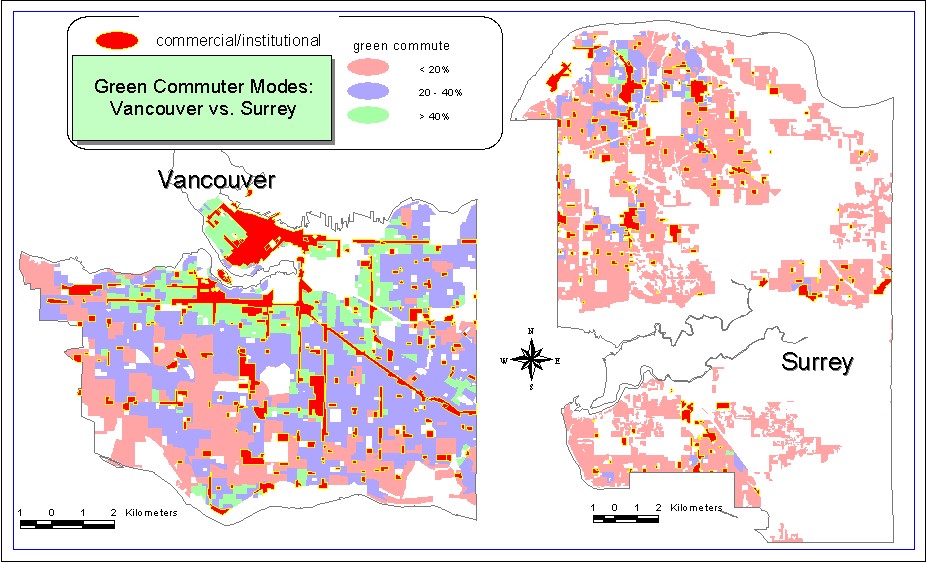
Vancouver and Surrey together contained 893, 496 (545, 671 and 347, 825 respectively) of the regions 1,986,965 residents as of May 15th, 2001, with Surrey receiving 27.9 per cent of the regions growth, and Vancouver, 20.4 per cent (GVRD, 2003). Contributing most significantly to Vancouver’s higher sustainability status are its comparatively more sustainable transportation and commuter patterns. According to 1996 census data, 53.9 per cent of all commuter trips made from the Vancouver/UEL sub-region were auto-driver, 24.3 per cent were transit, and 14.8 percent were walk/bike. This sub-region had the most sustainable commuter patterns in the region. In contrast, 77.5 per cent of all commuter trips originating in the Surrey/White Rock sub-region were automobile driver, 10.8 per cent were transit, and walk/bike only 4 per cent. Surrey’s commuter patterns showed less sustainability than the regional averages, which were 71.2 per cent, 6.5 per cent, and 13.8 per cent respectively (GVRD, 1998). Commuter mode shares by destination sub-region more or less reflected in those by sub-region of origin.
The graphic below compares commuter mode shares between Vancouver and Surrey.
An examination comparing built environment and urban form characteristics of Surrey versus Vancouver shows possible factors contributing to Vancouver’s higher sustainability in commuter patterns. The most significant contributing factors appear to be a combination of higher overall dwelling unit densities and higher commercial and office densities. Based on a range of densities identified by analysts in this field, for this analysis, sprawl densities are those below 4 dwelling units per/acre (dua), and transit supportive densities are those above 8 dua. Comparing the dwelling densities of Surrey with those of Vancouver shows that while Vancouver has a significant amount of transit supportive densities, the majority of residential areas in Surrey exhibit sprawl densities (DUA of 4 and less), a small proportion that is moderate or on the cusp of being transit supportive (4-8 DUA), and a small handful of enumeration areas that have sufficient densities to support transit.The graphic below shows and compares residential dwelling unit densities for both Vancouver and Surrey based on enumeration area.
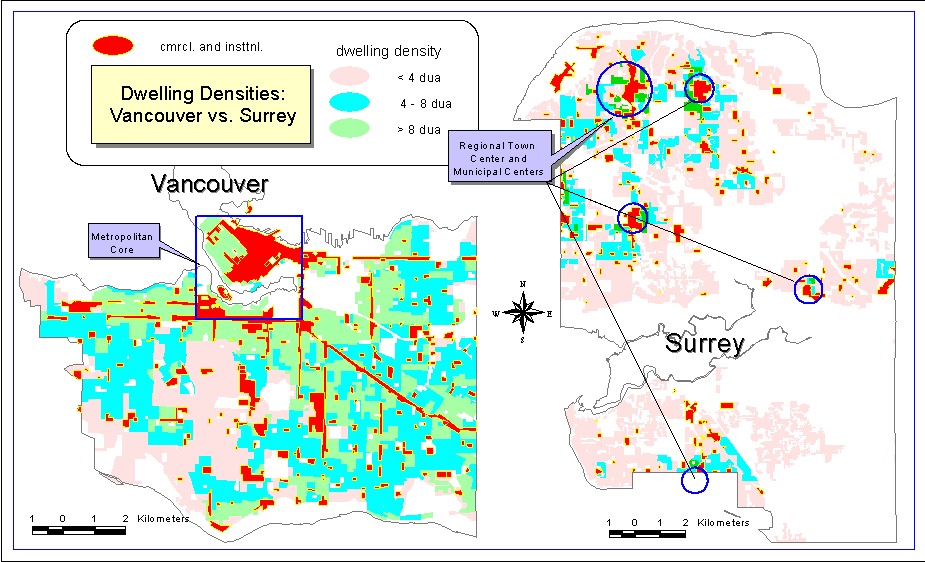
The amount of office parks also appears to significantly influence commuter patterns as well. While a significant amount of Surreys office space is located in office parks, which are generally poorly served by transit if served at all, a significant amount of Vancouver’s office space is located in the metropolitan core and in other commercial clusters, many of which are supported by high densities in the immediate vicinity. The map displaying dwelling densities and commercial land-uses for Surrey (above) shows that commercial uses are generally not supported by high, or even moderate dwelling densities.
Clearly, there are a variety of interrelated factors affecting transportation patterns in the GVRD. Identifying precisely the degree to which each individual factor affects transportation patterns is beyond both the scope and capabilities of this paper. However, it is possible to identify casual relationships between the various factors affecting transportation patterns in the region. The causal factors affecting transportation patterns identified in the analysis and shown with the various maps are: residential density, commercial density, income, and the proximity of non-residential uses, namely commercial and institutional uses, to residential uses.
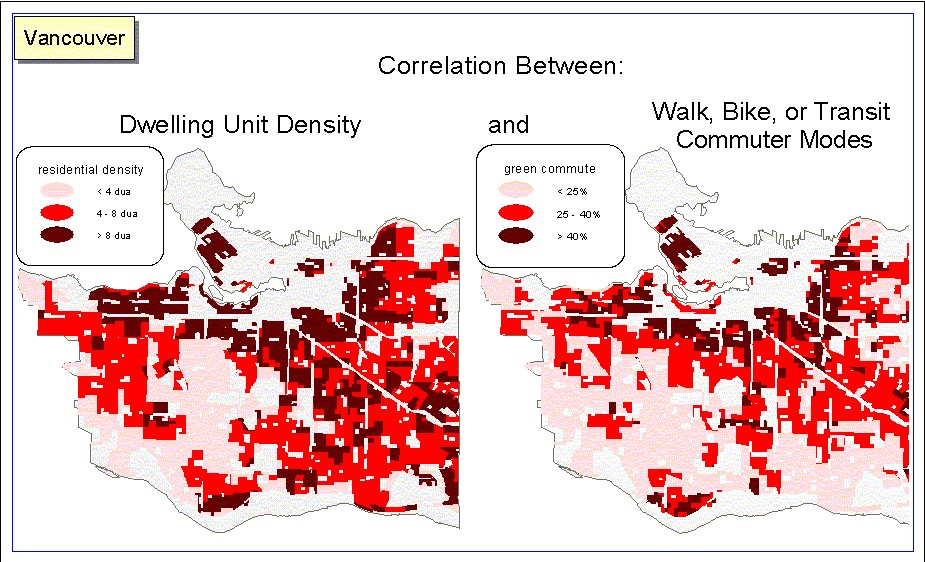
The following map shows a fairly significant positive spatial correlation between areas with high residential density and ‘green’ commuter modes (defined as either walk, bike, or transit commuter modes).
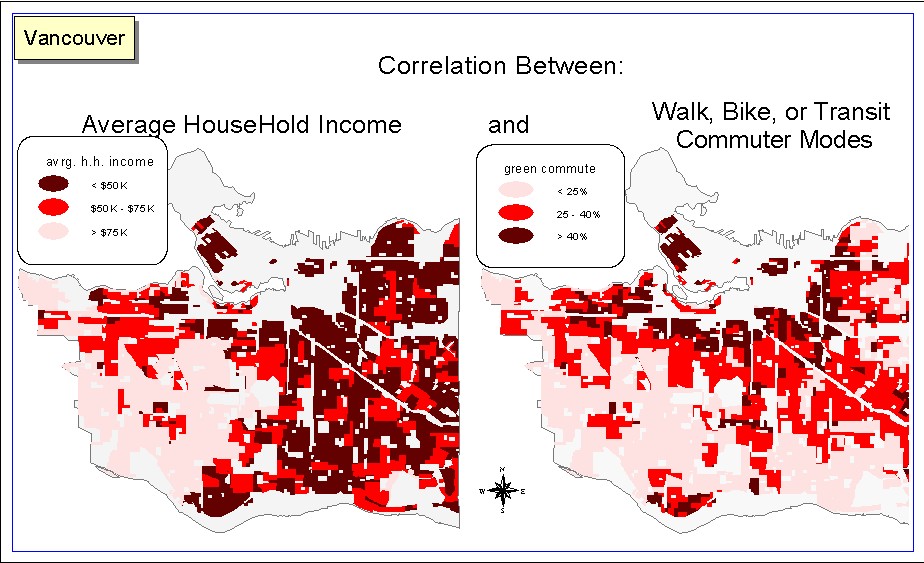
The following map shows a fairly significant negative spatial correlation between income and green commuter modes, revealing that low income areas in the region generally tend to have higher ‘green’ commuter rates, while higher income areas are generally more dependant on automobiles for the trip to work.
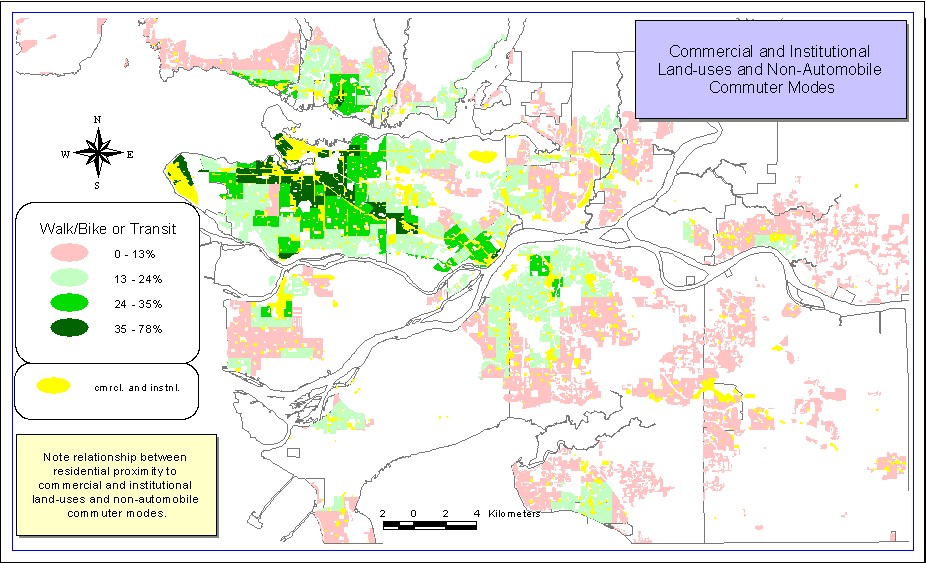
The following map (and shown earlier) displays commuter modes and commercial and institutional land-uses revealing a positive relationship between proximity to these land-uses and ‘green’ commuter modes.
The overall picture described by the various maps displaying the spatial distribution of transportation related factors shows that those areas in the region that tend to have more sustainable commuter modes also tend to be lower income, higher density, and closer to commercial and institutional land-uses. Regression analysis confirms the correlations between these factors.
The above analysis is limited in its scope and shows only broad and general relationships. More in depth analysis involving surveys as well as census and other statistical data is needed to identify more precisely, to the extent that it is possible, the degree to which each of the various factors combining to influence transprtation and land-use patterns does so. This analysis is intended to provide a broad and general description of the regions land-use and transportation patterns and of the significant factors that combine to influence them.
Limitations of Analysis/Suggestions for Further Research