Map Manipulation
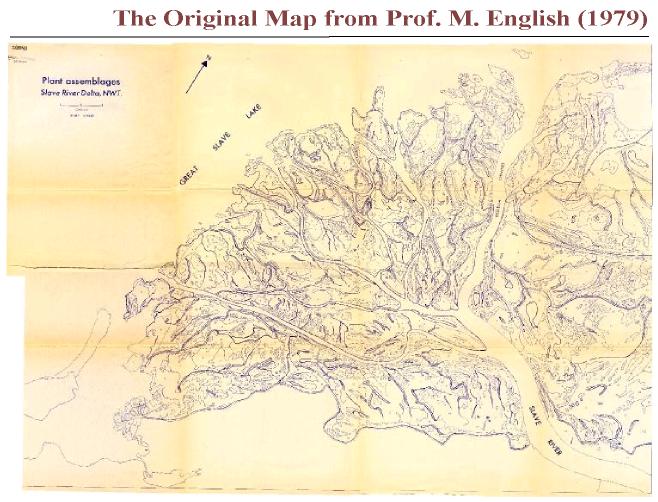
Colouring the map involves filling the different
polygons with different colours according to the vegetation classification
in the old map. The old map had to be photocopied first, thereafter,
colour pens were used to manually colour the different vegetation classes.
Then the coloured map was scanned into the computer in eight sections,
which were about 8 x 13 inches each. Finally, the map was merged
using the Freehand-software to produce a complete digital map.
Enhancement of the
Digital Map
The digital map was inaccurate; thus the classification
resulted in a noisy
image with different kinds of vegetation
in the same class. Moreover, polygons with similar colours were often
combined together. Consequently, enhancement was performed manually
in Adobe Photoshop one by one polygon to ensure a better classification
result.
Geo-Referencing
Our three base maps of the Slave River delta
were in three different formats. The old map was not referenced because
it was drawn from aerial photographs, the topographic map uses the UTM
12n system while, the Ikonos image utilizes the US 27tm 12n reference system.
For useful comparison it was necessary to convert all the maps to a common
projection with the same reference system. The geo-referencing process
encompasses two procedures: a) resample the old map to the topographic
map and b) referencing the resultant maps from a) to the Ikonos image (Images).
The resampling procedure was used as rubber sheet transformation that stretches
and warps the old map to fit the topographic map with its known reference
system. Control points with X,Y, coordinates were selected and recorded
on same features in the two maps. In Idrisi, these control points
were used to calculate the individual residual errors and the total “root
mean square (RMS)”. These residuals express how far the individual
control points deviated from the best fit equation. Values with less
than 0.05 are considered favourable and were kept whereas, high values
were omitted. After resampling, the old vegetation map should be
reoriented to match the topographic map with the UTM 12n reference system.
The second step was to match the resultant map's UTM 12n reference with
that of the Ikonos image's US27tm12n. The same procedure would be
repeated again and the final output would have the resultant map match
the Ikonos reference system.
Classification of the Old Map
The last step was to classify the map to get
distinct vegetation classes, each carrying a unique identifier to be able
to perform spatial analysis. The Isoclust performed the best in retaining
the original classes, and the
result was used for the spatial analysis
process.
 Processing
of the Old Map
Processing
of the Old Map