Chapter 10. Univariate inferential statistics
1. Say you want to know how many hours of television the average student watches per night. Say you have taken a random sample of 100 students, and that the mean number of hours for the ones in your sample is 7.50 and the standard deviation is 5.00.
a.What is your best estimate for the mean number of hours for all students?
7.5 hours -- same as the sample mean.
b. What is your best estimate for the standard error of the mean?
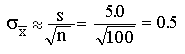 hours = SEM
c. If you want to be 95% certain about your answer, what is the range of error you must be willing to accept?
The size of the error will be 1.96 standard errors or 1.96 x
0.5 = 0.98 hrs. This means that the population's mean will be between your
sample mean minus 0.98 hours and your sample mean plus 0.98 hours. In numbers,
this is 7.5 ± 0.98 hrs. Or from 6.52 hrs. to 8.48 hrs.
d. How confident can you be that your estimate is accurate to within 1 hour?
An error of 1 hour would give you a z of 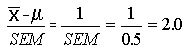 The area from the mean to z=2.0 is 0.4772. Your
sample mean could be either higher or lower than the population mean, so
you have to consider both positive and negative errors. You want the area
between z = -2.0 and z = 2.0, so 0.4772 × 2 = 95.44%
of samples would fall within one hour of the correct population mean.
The area from the mean to z=2.0 is 0.4772. Your
sample mean could be either higher or lower than the population mean, so
you have to consider both positive and negative errors. You want the area
between z = -2.0 and z = 2.0, so 0.4772 × 2 = 95.44%
of samples would fall within one hour of the correct population mean.
2. Say you want to know how many movies the average Vancouver high school student watches per month. Say you have taken a random sample of 200 Vancouver high school students, and that the mean number of movies for the ones in your sample is 14.00 and the standard deviation is 4.50.
a. What is your best estimate for the mean number of movies for all students?
14 movies -- same as the sample mean.
b. What is your best estimate for the standard error of the mean?
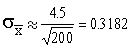
c. If you want to be 95% certain about your answer, what is the range of error you must be willing to accept?
At 95% confidence, you will be within 1.96 standard errors of the mean, which is ±0.624 movies.
d. If you want to be 99% certain about your answer, what is the range of error you must be willing to accept?
At 99% confidence, you will be within 2.58 standard errors of the mean, which is ±0.821 movies.
e. How confident can you be that your estimate is accurate to within 1 movie per month?
An error of 1 movie would give you a z of 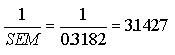 The area between the mean and z=3.142 is 0.4992. Since your mean could be
either too high or too low, you have to consider both positive and negative
errors. You want the area between z = -3.1427 and z = 3.1427, so
0.4992 × 2 = 99.84% of samples would fall within one hour of the correct
population mean. You can be 99.84% confident that your estimate is accurate
to within 1 movie per month.
The area between the mean and z=3.142 is 0.4992. Since your mean could be
either too high or too low, you have to consider both positive and negative
errors. You want the area between z = -3.1427 and z = 3.1427, so
0.4992 × 2 = 99.84% of samples would fall within one hour of the correct
population mean. You can be 99.84% confident that your estimate is accurate
to within 1 movie per month.
3. Say you want to know how many speeding tickets the average professor has received. Say you have taken a random sample of 100 professors, and that the mean number of tickets for the ones in your sample is 12 and the standard deviation is 3.
a. What is your best estimate for the mean number of tickets for all professors?
12 tickets -- same as the sample mean.
b. What is your best estimate for the standard error of the mean?
c. If you want to be 95% certain about your answer, what is the range of error you must be willing to accept?
At 95% confidence, you will be within 1.96 standard errors of the mean, which is ±0.588 tickets.
d. How confident can you be that your estimate is accurate to within 1 ticket?
An error of 1 ticket would give you a z of 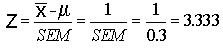 The area between the mean and z=3.333 is 0.4995 and your sample mean could
be either too high or too low. You have to consider both positive and negative
errors, so you want the are between z = -2.0 and z = 2.0, so 0.4995 ×
2 = 0.999, and 99.9% of samples would fall within one ticket of the correct
population mean. You can be 99.9% confident that your estimate is accurate
to within 1 ticket.
The area between the mean and z=3.333 is 0.4995 and your sample mean could
be either too high or too low. You have to consider both positive and negative
errors, so you want the are between z = -2.0 and z = 2.0, so 0.4995 ×
2 = 0.999, and 99.9% of samples would fall within one ticket of the correct
population mean. You can be 99.9% confident that your estimate is accurate
to within 1 ticket.
e. How confident can you be that your estimate is accurate to within 2 tickets?
You can be more than 99.99% confident. An error of 2 tickets would give
you a z of 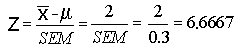 and the table only goes up to z= 3.90.
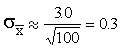
f. If your sample was 400 professors, what would be your best estimate for the standard error of the mean?
For a sample four times as large, the standard error would be one half as large, or 0.15.
g. If your sample was 400 professors, how confident could you be that your estimate is accurate to within 1 ticket?
An error of 1 ticket would give you a z of 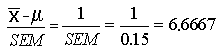 The area between the mean and z=6.6667 is more than 0.49995 and your sample
mean could be either too high or too low. You have to consider both positive
and negative errors, so you want the are between z = -6.6667 and z = 6.6667,
so more than 0.49995 × 2 = 99.99% of samples would fall within one
ticket of the correct population mean. You can be more than 99.99% confident
that your estimate is accurate to within 1 ticket.
The area between the mean and z=6.6667 is more than 0.49995 and your sample
mean could be either too high or too low. You have to consider both positive
and negative errors, so you want the are between z = -6.6667 and z = 6.6667,
so more than 0.49995 × 2 = 99.99% of samples would fall within one
ticket of the correct population mean. You can be more than 99.99% confident
that your estimate is accurate to within 1 ticket.
5. If you quadruple the size of a sample, how would this affect the width of a 99 percent confidence interval? How would it affect the width of a 95 percent interval? Why?
This will reduce them both by one half because the confidence interval is a function of two things: the confidence level and the standard error of the mean. Increasing the sample by a factor of four reduces the standard error by one half.
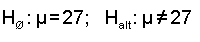
6. Nationally, about 27 percent of households have a computer with a connection (by modem) to the internet. You think this number is too low for a description of your community, so you do a survey with the goal being to collect data that will allow you to determine whether your suspicion is accurate. What is your null hypothesis? What is the alternate hypothesis?
7. The Universal Anti-Smoking Institute (UASI) runs a highly regarded program that claims to be more effective at convincing young people to stop smoking than all other similar programs. They claim that the average graduate of their program smokes fewer than 10 cigarettes per week. You have been asked by the Federal Truth In Advertising Commission to test the accuracy of the claims of the UASI. You begin your assessment by administering a test to a sample of 36 graduates of the UASI program. Your results show that the mean number of cigarettes smoked per week is 16 with a standard deviation of 22 cigarettes.
a. Could you get a sample with a mean smoking rate of 16 cigarettes per week from a population with a mean smoking rate of 10 cigarettes per week?
i. Use the 95% confidence level to answer this question.
SEM = 22/6 = 3.66667.
z = (16 -10) / SEM = 1.6363
At 95%, critical z is 1.96; since 1.6363 is less than 1.96, you fail to reject the null hypothesis, so the answer is yes, you could.
ii. Use the 90% confidence level to answer this question.
Your z is still 1.6363; at 90%, the critical z is 1.65; since 1.6363 is less than 1.65, you fail to reject; so the answer is still yes, you could.
b. Assume the claims of the UASI are truthful and accurate.
i. What are the chances of getting a sample of 36 graduates of their program with a mean smoking rate of 16 cigarettes per week and a standard deviation of 22 cigarettes?
Your z is still 1.6363; from Table 1, the smaller area for z=1.64 (the closest to 1.6363) is 0.0505. The probability of getting a z this large is p=0.0505 × 2 = 10.1%
ii. What are the chances of getting a sample of 36 graduates of their program with a mean smoking rate of 12 cigarettes per week and a standard deviation of 22 cigarettes?
z = (12 -10) / SEM = 0.5455
From Table 1, the smaller area for z=0.55 (the closest to 0.5455) is 0.2912. The probability of getting a z this large is p=0.2912 × 2 = 58.24%