 |
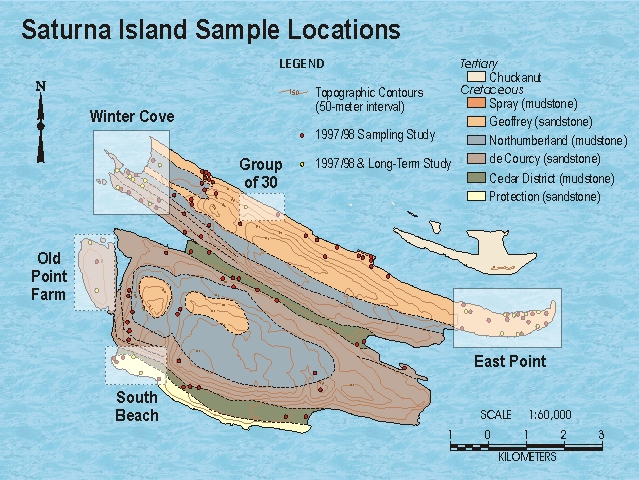
Click on a shaded area to see the graphs Introduction Groundwater supplies the majority of potable water in many coastal communities and islands in British Columbia. To better understand the processes that potentially threaten this valuable resource, it is important to consider its quality and quantity, and how these may change with time. 1997/98 Hydrochemical Sampling Program In 1997 and 1998, water samples were collected from wells, springs and surface waters on Saturna Island as part of a research study to characterize the nature and occurrence of saline waters, and to describe the chemical evolution of groundwater on the Gulf Islands. Major ion chemistry shows that groundwater is recharged locally, but mixes with saline waters that are typically characterized as having high chloride concentrations, which occur at depth or near the coast. The 1997/98 Hydrochemical Sampling Study on Saturna Island provides benchmark hydrochemical data for the island that can be viewed as a snapshot in time for reference in future studies of water chemistry. Long-Term Hydrochemical Sampling Program In 2002, a collaborative Long-term Hydrochemical Sampling Program was initiated between Simon Fraser University (Dr. Allen) and the residents of Saturna Island. The objective of the study is to track both seasonal (over the course of one or two years) and long-term variations in chloride and total alkalinity. Approximately 8 wells from each of East Point and Winter Cove, as well as a few wells from other areas of the island are included in the program (a total of 20 wells). The wells were selected on the basis of 1) obtaining a good representation of different "chemical types" and 2) willingness of the resident to participate in the study. Chemical trends are posted on this web site for the benefit of island residents. What do the graphs mean? Four graphs are shown for each sample region on Saturna Island. East Point and Winter Cove are plotted independently, while Old Point Farm, the Group of 30, and South Beach are plotted together. Samples are collected every month from June 2002 until November 2003 (roughly 18 months). From thereafter, samples are collected once every 6 months (May and November). The Conductivity and Chloride graphs essentially mimic each other as might be expected based on the fact that conductivity can be used as a surrogate measure of chloride. These graphs show that some samples have maintained fairly constant values of chloride over the course of the first year of sampling, while others have varied considerably. In most graphs, one sample tends to stand out as having high values or considerable variability (e.g., EP-27, WC-BP and OPF#3). We see more variability in the Alkalinity graphs, although no particular samples appear to stand out as being significantly different that the others. Variations in Alkalinity might be expected to be the result of variations in the contribution of fresh groundwater that are associated with recharge events. Based on this, we might expect to see a correlation, albeit perhaps shifted temporally, between precipitation events (or monthly precipitation) and the graph of HCO3/Chloride. There may even be some cyclicity between high relative concentrations of HCO3 to chloride, and precipitation. As more data become available during this sampling program, the relation between precipitation and the chemical parameters will be investigated in more detail. A continual decrease in the ratio of these parameters over the course of a year may represent a decline in the volume of fresh water that is stored in the aquifer. If a decline persists over a consecutive years, then contamination of the aquifer from saltwater intrusion may be the cause. Complicating the interpretation of these data is the absence of water use data. Some wells are used on a continual yearly basis, while others are only used during the summer or sporadically. Therefore, ongoing efforts will include an attempt to summarize water use for each sample site. |