Student Information
Physics 211 Prelab assignments
Note: This step is only necessary for Windows users. If you have a Mac, you may skip to the Software Installation step.
Driver installation instructions
- Start by downloading the windows driver installation application appripriate for your system.If you're not sure which system type you have, you can find this information by going to the Control Panel > System and Security > System. Under the System Type heading, you will be able to see whether your system is 32-bit or 64-bit.
-
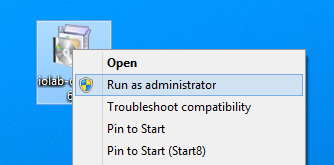
Do not double click to open file you just downloaded! Instead, right-click on the icon and select Run as administrator as shown below.
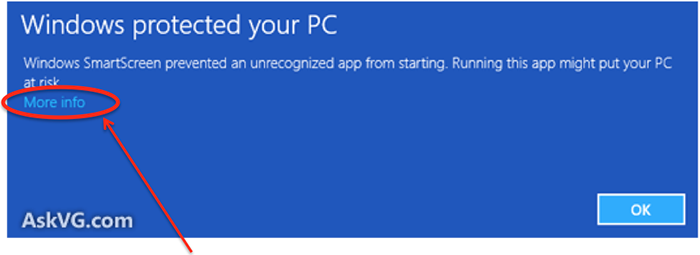
- On Windows 8 or 10 you may get a "Windows protected your PC" message. If this happens, click on More info, and then on the Run Anyway button that appears.
- Click Yes or Continue as needed until the installation is finished.
If you wish to view video instructions instead, you may do so below.
1)
Were you able to install the driver successfully?
IOLab Software Application download
Begin by downloading the latest version of the IOLab application for your operating system. (We will be working on the software during the course of the semester, so you may be asked to do this again at some point.)
PC Download: IOLabCEF_win32_0.37.1032.zip
Mac Download: IOLabCEF_macosx_0.37.1032.zip
This video will walk you through getting started with the software. Alternately, written instructions can be found below.
Opening the Software:
- Download the appropriate zip file for your computer.
- Extract the IOLabCEF folder onto your Desktop, Documents folder, or some other easy-to-find location on your computer. You must extract the folder from the zip file in order for the IOLab software to run.
- On a PC:Open the IOLabCEF folder, and click on the IOLabCEF file to open it.
On a Mac: Click IOLab.app to open the application
The application will look like this when you first open it.

Connecting the IOLab to the software
At the top of the application window there is a black bar indicating the status of the dongle and IOLab remote unit. At first, you will see that nothing is connected.

- Remove the USB dongle from the back of the IOLab remote unit. The video clip below shows how to do this by pressing down on the metal part of the dongle to make the back part accessible.
- Plug the USB dongle into your computer. If this is the first time you are using the IOLab system, it may take a few seconds for your computer to recognize it. The status bar will change to tell you when the dongle is connected.
Before:
Dongle not connected
After:
Dongle connected


- Next, press the power (
 ) button on the front of the IOLab remote unit to turn it on. You will see the remote status in the status bar change.
Before:
IOLab remote not powered
After:
IOLab remote powered


Your dongle and remote ID will be different than the numbers shown in the example image.
Once the dongle and remote are connected, you are ready to start taking data!
2)
Were you able to start the software and get the dongle and remote connected properly?
Before you take any measurements, you will need to calibrate the IOLab remote's sensors. There are two separate calibrations to do - one for the accelerometer/magnetometer/gyroscope sensors, and one for the force probe.
You will only need to do each calibration once unless you change computers. Calibration data is stored locally on your computer, so as long as you use the same IOLab device again on the same computer you will not need to recalibrate your device. If you use a different computer (like one of the EWS machines in 257 Loomis) you will need to repeat the calibration procedure before collecting data.
Calibrating the Accelerometers, Magnetometers, and Gyroscopes
Written instructions are below the video.
- Start the IOLab software, connect the USB dongle, and power on the IOLab remote. Make sure that you have a flat, horizontal, non-metallic surface in front of you.
- In the software, click the gear icon in the light grey bar to open up a drop down menu. Select "Calibration: Acc-Magn-Gyro."

- Follow the instructions in the software. You will place the IOLab remote in six specific configurations (e.g. x pointing up, x pointing down) then click 'Next' for the next configuration. The axes are labeled on the IOLab remote.
- When you are finished, the 'Next" button will change to a green 'Save' button. Click on the Save button to complete the calibration - if you don't do this then nothing will be saved and you will have to do the calibration again.
 |
 |
|
| Software instructions to place the IOLab remote and click 'Next' | Click 'Save' when you are finished. |
Calibrating the Force Probe
Written instructions are below the video
- Start the IOLab software, connect the USB dongle, and power on the IOLab remote. Make sure that you have one of the force probe attachments that came in your accessory kit (shown below), but do not attach anything to the force probe yet.

- In the software, click the gear icon in the light grey bar to open up a drop down menu. Select "Calibration: Force."
- Following the instructions on the software, first place the IOLab remote on a flat surface with the y axis pointing down toward the ground, then click 'Next.'
- Screw a force probe attachment in to the force probe, and use it to suspend the IOLab remote in the air. Hold the remote still and click 'Next.'
- When you have finished these two configurations, the 'Next' button will be replaced by a green 'Save' button. Click this to save your calibration data. Note: If you click 'Close' instead of clicking 'Save' you will have to start the calibration over again.
3)
Check the boxes below to indicate that you've completed each calibration.
There are three main parts of the IOLab software that you need to understand in order to take data.

- Sensor selection. Click the checkboxes to enable sensors on the IOLab remote. This will cause a graph to appear in the Data graphing area. You can use more than one sensor at once. Sensors that cannot work together are automatically disabled.
- Data graphing area. A graph will appear for each sensor that is enabled. The checkboxes under the sensor name control which traces will be shown in the graph. For example, in this image, acceleration values will be shown in the x, y, and z directions. These traces can be enabled before or after data collection.
- Data collection controls. These buttons control data collection as follows:
- Record. Starts data collection.
- Stop. Stops data collection
- Reset. One click resets graphs. Two clicks resets graphs and sensors.
A demonstration of these functions is shown in the video below.
4)
Try collecting data with the software. Did you have any difficulties?
Looking at your data in the IOLab software
There are several functions that will help you look at your data, both qualitatively and quantitatively.

To resize your graph window click in the lower right corner of the graph and drag to resize.
Data manipulation tools
- Graph button
 : Select this to view your data values or to use the analysis tools. You can view data values by hovering your mouse cursor over the data of interest in the graph. The values of your data will be displayed in the upper left hand corner of the graph area.

- Zoom button
 : Select this to enable zooming on your data. Click and drag a rectangle over the area where you wish to zoom. Click once on the graph area to zoom out.
 - Panning button
 : Select this to pan your graph. Click on the graph and drag until your data is located where you want to view it.
Data smoothing tool: This tool uses moving averages to smooth out the values in your graphs. This can be very useful if variations in data are due to sampling issues or you wish to see a general trend. However, it is important that you do not smooth so much that you destroy important features in your data!
Video explanations and demonstrations of all of these tools are below.
Using the data analysis tool
A text explanation is also available. It can be found on this page below the video.
The IOLab software has a built-in analysis tool that you can use to find the mean value of a measurement, area under a curve, or average slope of your data.

Click and drag with your mouse to highlight the region you'd like to analyze. You can cancel this selection by clicking once anywhere on the graph.
The following information appears in the upper right hand corner.
- Δt: The duration of the selected region, in seconds.
- µ: The average value of the measurement in the selected region.
- σ: The variance on the mean. This is a measure of how much the selected data varies from its mean value. In general, if you are reporting the mean value of your data, you want this number to be much smaller in comparison.
- a: The area under the curve accumulated over the selected region.
- s: The average slope of the data in the selected region. The r2 value in parenthesis is a measure of how closely your data matches a line with slope s. A r2 value of 0 means there is no match. A r2 value of 1 means there is a perfect match. If you are finding the slope of your data, you will usually want a r2 value as close to 1 as possible.
Each trace has its own values for µ, σ, a, and s. These values are displayed in lines with colors that match the traces. For example, in the picture above, the red text gives the values for the position measurement, Ry.
Reviewing previously collected data
Clicking 'Reset' will clear the graphs displayed in the IOLab software, but that does not mean your data is gone forever.
To access previous data collections, click on the folder icon (![]() ) in the light grey control bar.
) in the light grey control bar.
This will bring up the acquisition management window shown below. Data that you've collected have been saved locally on your computer and are displayed so that your most recent acquisition is at the top of the list. Click the acquisition you'd like to view, and the appropriate graphs will be displayed in the IOLab software.

A video demonstration is below.
Sharing your data in the IOLab online acquisition repository
- The online acquisition repository can be accessed using the cloud icon (
 ) in the light grey control bar.
- If you have never used the repository before, you will need to register as a new user. Otherwise, log in at this screen. After you log in, you should notice that the cloud icon in the main IOLab software window has changed to indicate that you can now upload your data.

- When you have data to upload, click the cloud icon (
 ). In the repository window, you will see that your data has been added to the repository.

- Click where indicated and give your data a descriptive title
- To share, click in the "Shared with" section and type the name of the person with whom you are sharing your data. Your data will now appear under this person's "Shared datasets" tab.
5)
After all this setup and software instructions, we want to make sure that you were able to get everything working before we assign the prelab assignment for Lab 2.
To show us that you've got things working (and to get credit for completing this prelab), do the following:
- Use the IOLab system to collect data of anything you want using the sensor(s) of your choice.
Examples: Measure light intensity in your room with the light sensor, measure the motion of an elevator with the accelerometer (or barometer!), measure the force of a stretched spring with the force probe, etc. - Create an account in the IOLab online repository and log in.
- Push your data to the repository
- Give the data a descriptive title
Good title: " Force of a stretched spring"
Bad title: "Force graph" - Share the data with your instructor, Katie Ansell. Type her name in the "shared with" and you should see her pop up as a repository user.
- Once you have shared your graph with Katie, click the "Yes" button below.
Did you share a graph of your recorded data with your instructor?
6)
Write a brief description of what you recorded in the data you shared with your instructor.
E.g., "I used the microphone to measure the sound my alarm clock makes"