Chapter Contents
Previous
Next
|
Chapter Contents |
Previous |
Next |
| The NPAR1WAY Procedure |
The empirical distribution function (EDF) of a sample {xj}, j = 1,2, ... ,n, is defined as the following function:
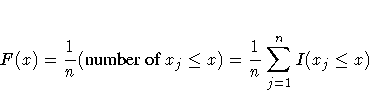
where I(·) is the indicator function. PROC NPAR1WAY uses the subsample of values within the ith class level to generate an EDF, Fi. The EDF for the pooled sample can also be expressed as

where ni is the number of observations in the ith class level, and n is the total number of observations.

The asymptotic Kolmogorov-Smirnov statistic is computed as
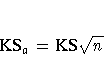
In addition to the overall Kolmogorov-Smirnov statistic
and the asymptotic statistic, PROC NPAR1WAY displays the
values of the Fi at the maximum deviation from F, the
values ![]() at the maximum deviation from F,
the value of F at the maximum deviation, and the point where
this maximum deviation occurs.
at the maximum deviation from F,
the value of F at the maximum deviation, and the point where
this maximum deviation occurs.
If there are only two class levels, PROC NPAR1WAY computes the two-sample Kolmogorov statistic as
PROC NPAR1WAY also computes the asymptotic probability of observing a larger test statistic. The quality of this approximation has been studied by Hodges (1957). For tables of the exact distribution of D when the two sample sizes are equal, refer to Lehmann (1975, p. 413). For tables of the exact distribution for unequal sample sizes, refer to Kim and Jennrich (1970, pp. 79 -170).
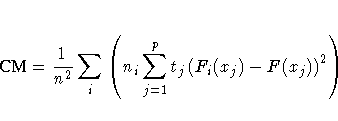
where tj is the number of ties at the jth distinct value and p is the number of distinct values. CM measures the integrated deviation of the EDF within the classes to the pooled EDF. PROC NPAR1WAY displays the contribution of each class to the sum together with the sum, which is the asymptotic value formed by multiplying the Cramer-von Mises statistic by the number of observations.
The asymptotic value is
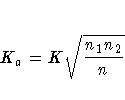
The p-value is the probability of observing a larger value of Ka under the null hypothesis of no difference between the two classes.
|
Chapter Contents |
Previous |
Next |
Top |
Copyright © 1999 by SAS Institute Inc., Cary, NC, USA. All rights reserved.