Research
SIAT researchers publish study on user-friendly interactive data visualization tool
By Clare Slipiec
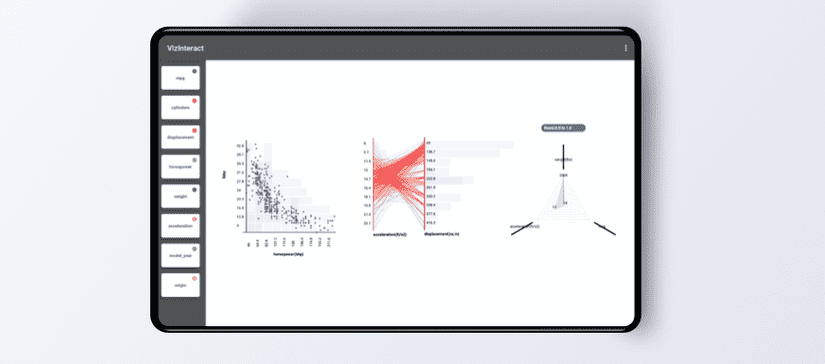
School of Interactive Arts & Technology (SIAT) professor Wolfgang Stuerzlinger and researcher Supratim Chakraborty recently published their study on VizInteract, an interactive data visualization tool for touchscreen displays that allows users to easily create and edit visualizations using simple multi-touch actions and gestures.
Since raw data can be complex and difficult to understand, Stuerzlinger and Chakraborty saw the need for accessible tools that facilitate easy data exploration for both casual and expert users.
"Interactive visualization tools that make it easy for people to quickly access and see the data they work on are crucial," comments Stuerzlinger of the project.
Despite the importance of accessible tools, however, building multi-dimensional data visualizations, like scatterplots or 3D graphs, is often a complex process. Users are often required to use complex tools that typically involve detailed specifications, sometimes even writing code.
Considering these limitations, Stuerzlinger and Chakraborty set out to create a user-friendly system that empowers novice and expert users alike to easily explore data and create various charts for their data.
"In contrast to current desktop tools, VizInteract offers a simple, yet efficient, touch-based user interface for people to create and iteratively modify visualizations," says Stuerzlinger. "VizInteract enables users to fluidly think around their data."

Two histograms can be brought close together to create a visualization. Graphic by Supratim Chakraborty.
Using VizInteract, users can quickly compose and filter charts, easily analyze relationships between parameters, and find high performing variables.
Stuerzlinger and Chakraborty conducted two exploratory user studies to investigate how users interact with the tool.
The goals of the study were to observe users' progress with simple touch-based interaction on a tablet and to investigate data exploration behaviours while users interacted with VizInteract on a large touch display.
In these studies, Stuerzlinger and Chakraborty found that the multi-touch interface of VizInteract allowed users to rapidly construct and edit complex visualizations.
Study participants were quickly able to complete realistic visual analytic tasks and gain valid insights from the data. Due to the touch-based user interface of VizInteract, multiple people were also able to work easily and seamlessly together on large screens.
With these promising findings on VizInteract, Stuerzlinger and Chakraborty will be continuing their research on collaborative, interactive data analytics going forward. They also plan to continue to expand the functionality of VizInteract, including adding a version that works in virtual and augmented reality.

Creating scatter plots: to construct a scatter plot for two attributes, first change the orientation of any graph using a two-finger rotate gesture and then bring them close to overlap each other. Graphic by Supratim Chakraborty.
F T I