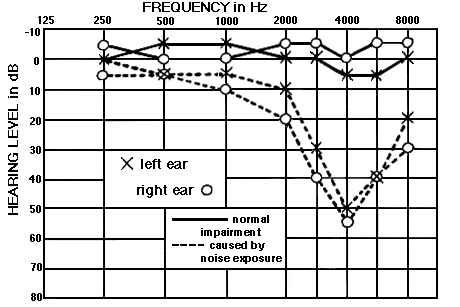
A graph showing HEARING LOSS as a function of FREQUENCY as measured by an AUDIOMETER. 0 dB on an audiogram denotes the hearing threshold level regarded as the normal audiometric standard at that frequency (see EQUAL LOUDNESS CONTOURS). Points below 0 on the scale denote louder threshold levels, whereas those above, expressed in negative decibels with respect to the zero level, are less intense levels which, because of individual hearing differences, some people may normally hear.
See: DAMAGE-RISK CRITERIA, DECIBEL, HEARING LEVEL, THRESHOLD OF HEARING. Compare: PRESBYCUSIS.

A typical audiogram comparing normal and impaired hearing. The dip or notch at 4 kHz as shown, or at 6 kHz, is a symptom of noise-induced hearing loss.
![]() Sound
Example: The above sentence heard with
a simulation of normal, then impaired hearing of the type
illustrated in the diagram.
Sound
Example: The above sentence heard with
a simulation of normal, then impaired hearing of the type
illustrated in the diagram.
home