You might be thinking, “How would I know when statistics are inaccurate?” unfortunately, it is difficult to draw conclusions when statistics can be interpreted and manipulated in a multitude of ways. For example, one article could claim that women in STEM jobs are becoming more prominent with a high profile company claiming the number of women employed by the company has increased by 50%. However, if they had previously employed one woman, then hired one more woman, the statistics would be correct, but improvement on the part of the company would reveal a much more humble number. In reality, the company had only employed one extra women, perhaps for the sake of appeasing the media.
Interpreting Statistics
June 08, 2018
Written by: Gabby Chia
If you’ve ever scrolled through the depths of informational social media news outlets like Facebook, Reddit, or Twitter, you’ve likely come across attractive statistics that seem to reinforce what we already think we know. On the other hand, we might come across a statistic which we believe profusely to be false. We have to be careful with our susceptibility towards reinforcement when statistics can be miscommunicated.

A Critique of Recent Studies
So how are women in STEM really doing? It is generally agreed upon that there is a disproportionately low number of women in STEM compared to men. However, the reasoning ranges throughout studies. For example, one study by Stoet & Geary suggests countries with higher gender equality (quantified using data on earnings, tertiary enrollment ratio, life expectancy, and seats in parliament from The World Economic Forum), are correlated with having fewer women in STEM jobs. Stoet & Geary suggest multiple explanations, most convincingly, that women in low equality countries are more likely to go for high paying and valuable jobs to minimize professional gender inequalities through their achievements. Another study by Kugler, Tinsley & Ukhaneva suggests in exclusively male-dominated STEM fields, women are less likely to continue in their academic field due to poor performance than men.
We hear tons of arguments, but what's really going on? The best way to be informed of what all these statements mean, is to look at how they were generated: statistical analysis. Statistical analysis is defined as the “Collection, examination, summarization, manipulation, and interpretation of quantitative data to discover its underlying causes, patterns, relationships, and trends”. It sounds like a mouthful, but I promise, it's not as hard to understand as it sounds. Let's take a look at how all those fancy infographics come to be so we can see how seriously we can take them.
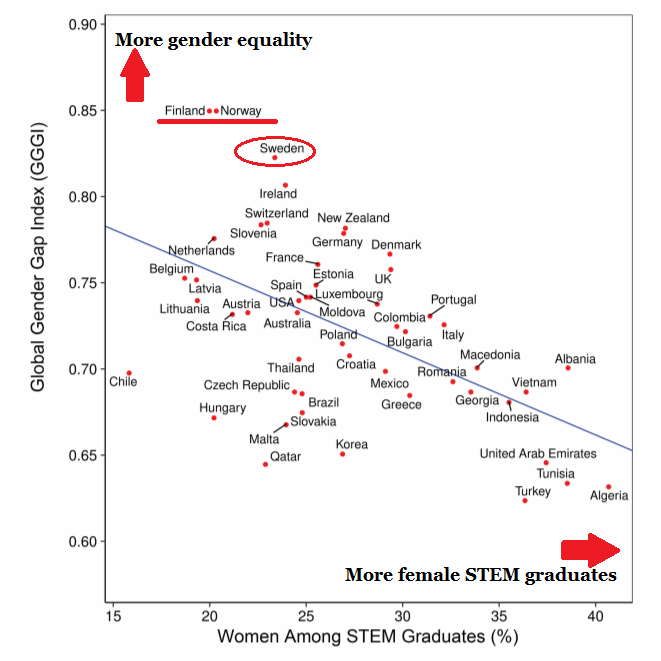
In the study by Stoet & Geary, they plot their measurements of gender equality to the number of female graduates in STEM. The most gender equal countires being Finland and Norway reveal to have the largest gender gap in STEM graduates; and the least gender equal countries, Turkey, Algeria, and Tunisia, have the most gender proportionate STEM graduates. I know this sounds counter-intuitive to the equality movement, but remember, we can’t take all information at face value. It is important to understand the value in the studies that reflect our views AND the ones that challenge them. To be critical of both provides us with a broader perspective and prevent bias from clouding our judgement. Without further ado, let’s pick out some plot holes of this study to see how the information is valuable, while keeping in mind potential fallacies. Not necessarily an issue, but one note to consider about the article, it is not anti-women in STEM, and it does not test the cultural verses biological argument, but takes a biological perspective. That being said, many news sites who have posted about this study do not address these points. The authors use PISA, the world’s largest educational survey to compare female/male results on subjects like reading, science literacy, etc. They found that women tended to be better at reading, and men tended to have stronger math and science literacy on a nearuniversal level. However, it does not suggest whether or not men and women are predisposed to become better in their respective subjects due to some kind of cultural or social influence, or if it was a biological component. Although it is not significant for this to be tested in this study, it is significant when this information is portrayed in the media without helping readers consider other variables. Now, how does this relate to statistics? If there is a significant social influence that effects the student’s skills, although the statistics are correct, the message those numbers may bring across as a result of a biological perspective may be damaging. The media likes to use statistics to make their article seem more reliable, but using statistics without a consideration of other factors can be dangerous. Most readers will not bother to fact-check or read the original article and will therefore not likely consider the unannounced and more complex problems. In this case, the issue is not with the study, but with how the study can be portrayed.

Now, as I mentioned earlier, it is easy to be critical of works you disagree with, however, it can be remarkably difficult to want to pick apart a study that reinforces your beliefs, but it is equally important, if not more, to understand the opposing perspective. In the study by Kugler, Tinsley & Ukhaneva, the authors suggest that men and women respond equally to low relative grades and negative feedback, however, women are more discouraged to continue in their field when receiving low grades and negative feedback in male-dominated STEM fields than men. The authors continue to argue that STEM fields are heavily associated with masculinity and targeted during recruitment as masculine professions. Additionally, statistics from the United States Department of Commerce shows that “women with STEM degrees are less likely than their male counterparts to work in a STEM occupation; they are more likely to work in education or healthcare”. These studies could suggest that women experience more internalized consequences for issues, and therefore decide not to pursue the career postgraduation. One possible issue with this study is the small sample size. In other words, the small sample of people who chose to participate in the study. The authors conducted this study with one private university. Although they suggest the university is quite large, there is an issue with the population sample, all the people in the sample have a common factor: they attend a private university on the East Coast. Still don’t see the problem? Let’s break it down. The people in the sample are people who have the same opportunity, financial ability, geographical closeness, and preference to that particular university. Therefore, it creates a very specific sample size that cannot necessarily be generalized to the broader public.
What Can Effect Statistical Analysis?
Generating statistics can go astray at any part of the process. From data collection to interpretation, misinformation can be easily concluded. This is the reason why we have multiple scientists studying the same theories and replications of previous studies, which are then peerreviewed by other professionals to indicate whether the study was reliable enough. This is not to say that all statistics are incorrect, but more that we must be critical of the information people present us, as this helps us get a more truthful understanding of the subject. There are three steps in the creation of statistics: collection, analysis, and interpretation.
Collection: Data Collection
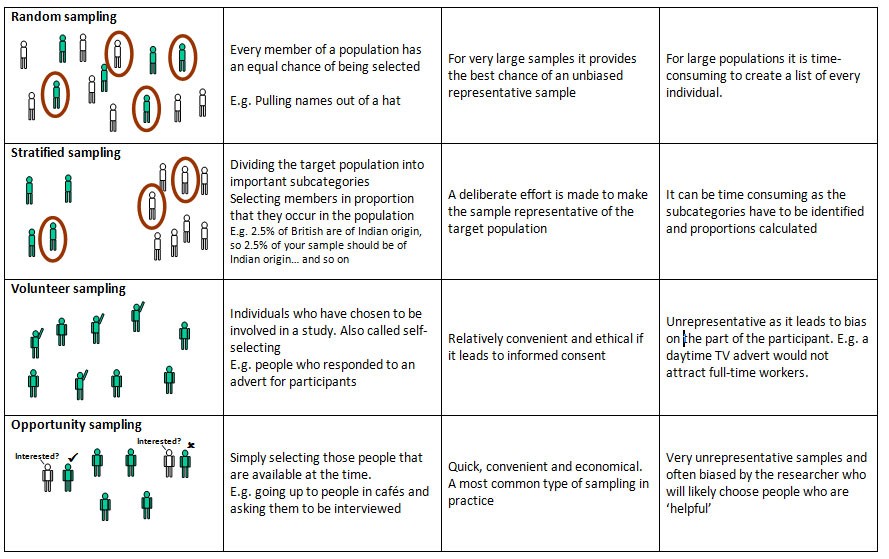
There are several aspects of data collection to keep in mind when reviewing the design of a study: Sample of participants, what type of experimental design, how to control extraneous factors, ethics, and an entirely different set of rules for correlational or survey studies. As I had highlighted earlier, sample size is a pressing and relevant issue to be considered in every study. Since we always need real population samples to get the most accurate information on the population in question, but people can range in their susceptibility to the design of the study and line of questioning, there are many biases that can affect the reliability of the study. For example, the sample size has to be large enough to eliminate chance results (ie. Smoking doesn’t give you cancer because my grandpa smoked every day and lived till 90 is an extremely small sample size), it has to be representative of most of the population (ie. Setting up a booth in front of the library does not get you results of the majority of the students, just ones who tend to go to the library or have classes that require them to pass the library at that time), and sample groups should be sufficiently randomized depending on the experiment (ie. If you group friends together, they may be predisposed to the same experiences and attitudes and thus effect their responses).
Analysis: Running Numbers/Survey Questions
The next step in the process of creating a study, is analyzing the information. One aspect to consider when reading a study is their methodology. If they used a questionnaire to generate responses, did they word the questions in a way that did not bias the participant’s answers? How did they translate the responses into numerical data? If participants rated their answers on a scale of 1 to 5, 1 being do not at all agree, and 5 being very much agree, each participant could interpret each rating differently.
Interpretation
The last piece of the puzzle is to interpret the data. You might be familiar with measures of central tendency, also known as the three averages (mean, median, and mode), from your high school mathematics class, however, did you know they can be distorted with extreme values? For instance, if researchers attempted to find the average monthly income of a first year university student, they might find that most fall within $500-$1000 a month. However, if there happened to be one successful entrepreneur in the mix who submitted an average monthly income of $10,000, the mean (a.k.a. average) would be skewed and it would produce results which are inaccurate of the true average.

Hopefully you walk away (or more likely click away) from this blog post with a better understanding on what to look out for the next time you see a story with a snappy title and fancy infographic on your social media feed. We must learn to be critical of perspectives we favor so we can develop a better understanding of the perspective we don’t. With less argumentation, and more critical thinking we can more readily work towards resolving longstanding issues. There is a lot of value in different perspectives, and we can learn from the diversity of beliefs and understandings to build the base of our own ways of thinking.
If this blog post was interesting to you, look out for a future blog post on how statistics can be distorted by the media!