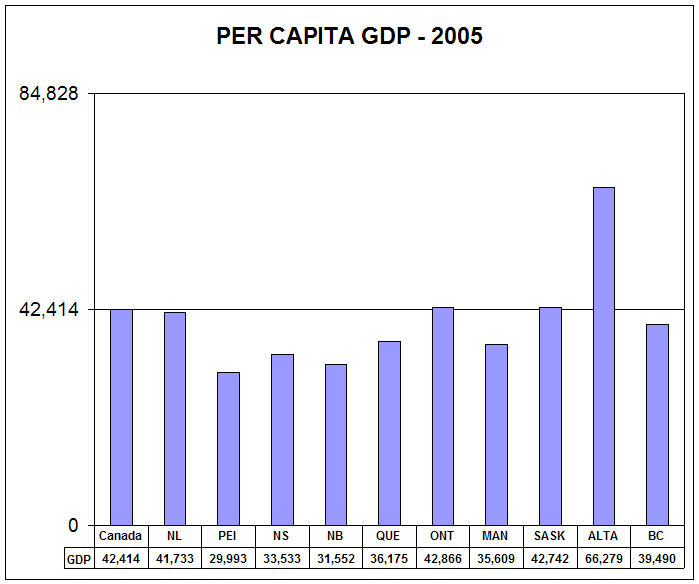
| Enormous economic disparities between the Canadian provinces are at the root of the equalization program.
In the period 2001-5, Canada saw significant changes to the economic
balance of the country. With the escalating price of oil, GDP increased
in Newfoundland & Labrador, Saskatchewan, and Alberta. The economic
impact of the oil development offshore from Newfoundland saw the most
dramatic shift in economic fortunes. As a result, the per capita GDP in
Newfoundland and Labrador went from 76% of the national level to 98%.
Ontario's share of economic output slipped in relative terms over the
same period, from 107% of the national per capita GDP to 101%.
|
| PER CAPITA GDP 2001-5 | |||||
| 2001 | 2002 | 2003 | 2004 | 2005 | |
| Canada | 35,719 | 36,790 | 38,403 | 40,351 | 42,414 |
| Newfoundland and Labrador | 27,163 | 31,675 | 34,968 | 37,566 | 41,733 |
| Prince Edward Island | 25,099 | 27,137 | 28,004 | 29,173 | 29,993 |
| Nova Scotia | 27,787 | 28,977 | 30,669 | 31,871 | 33,533 |
| New Brunswick | 27,582 | 28,191 | 29,525 | 30,549 | 31,552 |
| Quebec | 31,313 | 32,503 | 33,676 | 35,118 | 36,175 |
| Ontario | 38,134 | 39,509 | 40,242 | 41,702 | 42,866 |
| Manitoba | 30,537 | 31,710 | 32,472 | 34,174 | 35,609 |
| Saskatchewan | 33,124 | 34,468 | 36,595 | 40,228 | 42,742 |
| Alberta | 49,489 | 48,395 | 54,176 | 58,397 | 66,279 |
| British Columbia | 32,737 | 33,594 | 35,129 | 37,421 | 39,490 |
| RATIO OF PER CAPITA GDP TO NATIONAL 2001-5 | |||||
| 2001 | 2002 | 2003 | 2004 | 2005 | |
| Canada | 1.00 | 1.00 | 1.00 | 1.00 | 1.00 |
| Newfoundland and Labrador | 0.76 | 0.86 | 0.91 | 0.93 | 0.98 |
| Prince Edward Island | 0.70 | 0.74 | 0.73 | 0.72 | 0.71 |
| Nova Scotia | 0.78 | 0.79 | 0.80 | 0.79 | 0.79 |
| New Brunswick | 0.77 | 0.77 | 0.77 | 0.76 | 0.74 |
| Quebec | 0.88 | 0.88 | 0.88 | 0.87 | 0.85 |
| Ontario | 1.07 | 1.07 | 1.05 | 1.03 | 1.01 |
| Manitoba | 0.85 | 0.86 | 0.85 | 0.85 | 0.84 |
| Saskatchewan | 0.93 | 0.94 | 0.95 | 1.00 | 1.01 |
| Alberta | 1.39 | 1.32 | 1.41 | 1.45 | 1.56 |
| British Columbia | 0.92 | 0.91 | 0.91 | 0.93 | 0.93 |
|
Sources: Statistics Canada All sites accessed May 22, 2006 |
Copyright © 2006 Andrew Heard