Research
Research
The following movies are simulations of cell movements in
Dictyostelium discoideum as part of a PNAS paper:
A 2-D slug organized by two cAMP pacemaker.
slug.straightgraft.qt
A 2-D slug organized by two cAMP pacemaker, but cells are more active.
slug.turnsgraft.qt
Aggregation in response to a pacemakers in the center.
No adhesion, 2500 cells.
aggre.ad0.qt
Normal adhesion, 2500 cells.
aggre.ad1.qt
Normal adhesion, 10000 cells.
aggre10k.qt
Sorting of two cells types in an aggregate, due to differnces in
adhesion. The green cells are two times more adhesive than the red
cells.
Normal view.
cellsort1000aX.qt
A crossection through the middle of the aggregate.
cellsort1000aX.strip.qt
Simulations of cell movements.
These quicktime movies show a
number of different simulations of cell movements in multicellular
systems. The cells are deformable and can exert force onto neighboring cells.
Here 100 cells are aggregating towards chemical waves originating
from the center. aggre100.jpg10.qt ,
aggre100.mpg
Here 500 cells are aggregating aggregating towards chemical waves
originating from the center.
aggre500.jpg10.qt ,
aggre500.mpg
This simulation shows how cells sort based on differences in adhesion
strength. The adhesion between two green cells is 2X larger than the
adhesion between two blue cell. The initial configuration of cells is
random. cellsort500.rand.jpg10.qt
,
cellsort500.rand.mpg
This simulation shows how cells sort based on differences in adhesion
strength. The adhesion between two green cells is 2X larger than the
adhesion between two blue cell. The initial configuration of cells is
regular cellsort500.reg.jpg10.qt ,
cellsort500.reg.mpg
Cells moving up a cAMP gradient.
chemo.grad100.jpg10.qt ,
chemo.grad100.mpg
Cells moving towards a planar cAMP wave.
chemo.wave100.jpg10.qt ,
chemo.wave100.mpg
Cells moving towards a planar cAMP wave.
chemo.wave8.jpg10.qt ,
chemo.wave8.mpg
The following simulations show a aggregate of thousands of cells that
are compressed between 2 plates. By keeping track of the force applied
on the plates, we can calculate the surface tension of the aggregate
and get a relation between the adhesion strength and surface
tension, following experiments done in Malcolm Steinberg's Lab at
Princeton University. The different simulations differ in the adhesion
(ad) between the cells or the distance (h)i between the two plates.
plate.ad04.jpg10.qt
plate.ad04.mpg
plate.ad08.h8.9.jpg10.qt
plate.ad08.h8.9.mpg
plate.ad08.jpg10.qt
plate.ad08.mpg
plate.ad10.h7.5.jpg10.qt
plate.ad10.h7.5.mpg
plate.ad10.h9.jpg10.qt
plate.ad10.h9.mpg
plate.ad15.h7.5.jpg10.qt
plate.ad15.h7.5.mpg
plate.ad15.jpg10.qt
plate.ad15.mpg
plate.ad30.jpg10.qt
plate.ad30.mpg
plate.press3500.jpg10.qt
plate.press3500.mpg
The following simulations show sorting of cells due to differences in
adhesion. After the most adhesive cells have sorted to the center, the
adhesion between the less adhesive cells is increased while keeping
the adhesion between unlike cells the same.
spore.stalk1.jpg10.qt
spore.stalk1.mpg
spore.stalk2.jpg10.qt
spore.stalk2.mpg
The generation of cAMP wave patterns in aggregating
Dictyostelium. amoebae can be seen in the timeseries
below. Also shown is a timeseries from a simulation lation of
the initiation of these waves.
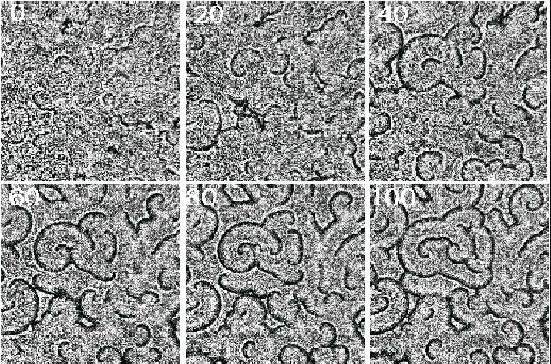
Time lapse (min.) data of Dictyostelium amoebae aggregating
on a thin layer of agar under dark field optics. Dark bands correspond
to moving cells and indicate high cAMP concentrations. Field is 18x18 mm. Cells plated at a
density 2x10^6 cells cm^2.
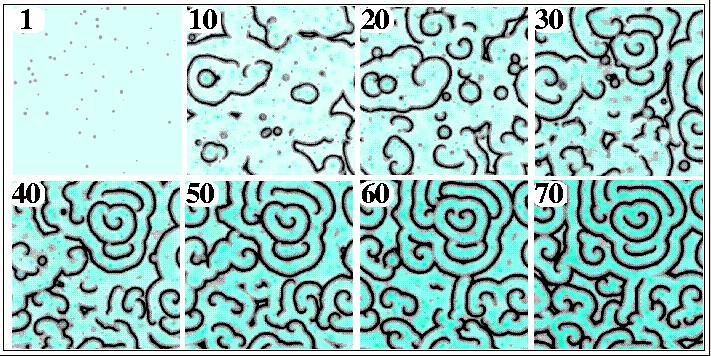
Numerical Simulation of cAMP wave formation in Dictyostelium.
Random spatial secretions of PDI concentrations can account
for the establishment and evolution of wave patterns. Cells secrete
PDI with a low probability and send out cAMP pulses as a result. The
transition from pulsing cells (panel 1) through circular waves
(panels 10 to 40) to spirals (panels 30 to 70)
begins with secretion of PDI, forming waves, which break up when new
pulses are initiated in the wake of passing wave. Panels 1 -- 70
= 4, 40, 80, 120, 160, 200, 240, and 320
min. respectively. Increasing PDI levels correspond to increasing blue
intensity, cAMP levels are in grayscale.
METHODS. The model has random temporal and spatial secretions of PDI
(probability of PDI secretion = 0.5 x 10^-6 / timestep /
cell). The diffusion constants for cAMP and PDI where 4 x
10^-6 cm^2 sec^-1 and 8.3x10^-7 cm^2 sec^-1 . The
model was solved using a second order Runge-Kutta method for time and
an ADI scheme for space. The grid resolution was 400 x 400 with
dx,dy = 0.1 mm, dt= 0.04 min.
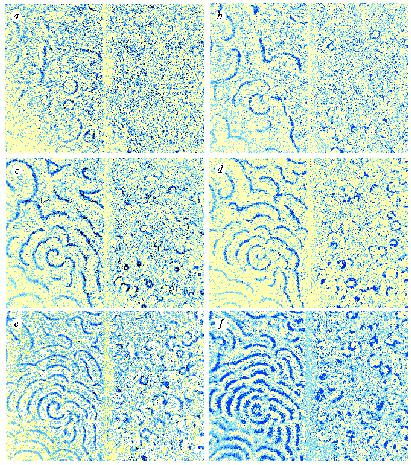
The evolution of targets and spirals in a parental and a
phosphodiesterase inhibitor mutant strain of Dictyostelium.
In each panel the parental strain is on the left, separated by a faint
line from the mutant on the right. Dark bands correspond to peaks in
cAMP concentration. a -- f = 271, 321, 344, 368, 396, and
422 min. respectively, after harvesting and plating the cells. Scale
bar, 5 mm.
METHODS. Vegetative Dictyostelium DH1 and
PDI- mutant derivatives were plated side by side on agar surfaces,
separated by a thin glass plate, at 5.4 x 10^5 cells cm^{-2}. Video
images were gathered by dark field illumination. Each image was
obtained by subtracting two successive images to enhance the signal to
noise ratio. The PDI- mutant, isolate 27, carries an extensive PDI
deletion. Similar results were obtained with three other
independently isolated PDI deletions, 10-2, 9-2, and 9-6.