STAT 350: Lecture 12
Multiple Regression
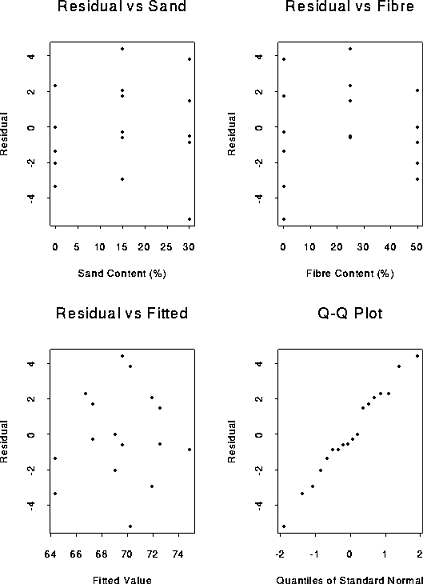
See Lecture 11 for the basic analysis of this data set. Here is a page of plots:

You will see that the plot of residual against fitted value suggests that we should consider adding a quadratic term in Fibre:
The model
![]()
has ESS=87.083 on 14 degrees of freedom while the model
![]()
has ESS 108.861 on 15 degrees of freedom. The F statistic is 12*(108.861-87.083)/87.083 =3.00 with a corresponding P-value of roughly 0.10. Thus the evidence that a quadratic term is needed is weak.