STAT 350: Lecture 18
The SCENIC data set
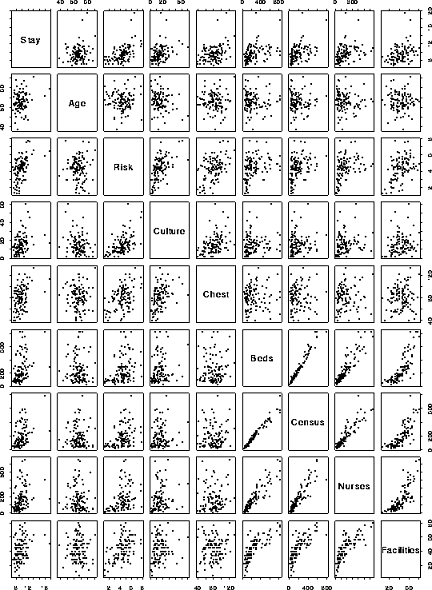
The data set is described in the Appendix of the text. Here I reproduce a page of pair-wise scatter plots for all variables except the categorical variables Region and School.

It is evident from the plot that, as expected, several of the variables are quite highly correlated. Here is the correlation matrix:
| Stay | Age | Risk | Culture | Chest | Beds | Census | Nurses | Facilities | |
| Stay | 1.00 | 0.19 | 0.53 | 0.33 | 0.38 | -0.49 | 0.47 | 0.34 | 0.36 |
| Age | 0.19 | 1.00 | 0.00 | -0.23 | -0.02 | -0.02 | -0.05 | -0.08 | -0.04 |
| Risk | 0.53 | 0.00 | 1.00 | 0.56 | 0.45 | -0.19 | 0.38 | 0.39 | 0.41 |
| Culture | 0.33 | -0.23 | 0.56 | 1.00 | 0.42 | -0.31 | 0.14 | 0.20 | 0.19 |
| Chest | 0.38 | -0.02 | 0.45 | 0.42 | 1.00 | -0.30 | 0.06 | 0.08 | 0.11 |
| Beds | 0.41 | -0.06 | 0.36 | 0.14 | 0.05 | -0.11 | 0.98 | 0.92 | 0.79 |
| Census | 0.47 | -0.05 | 0.38 | 0.14 | 0.06 | -0.15 | 1.00 | 0.91 | 0.78 |
| Nurses | 0.34 | -0.08 | 0.39 | 0.20 | 0.08 | -0.11 | 0.91 | 1.00 | 0.78 |
| Facilities | 0.36 | -0.04 | 0.41 | 0.19 | 0.11 | -0.21 | 0.78 | 0.78 | 1.00 |