

In addition to the residual plots already discussed there are a number of
formal statistical procedures available for diagnosing problems with the
fitted model.
Problems with individual data points
- An individual point may be a Y "outlier". Diagnostic tools:
Internally studentized residuals, PRESS residuals or externally
studentized (case-deleted) residuals; latter most sensitive.
- An individual point may be an X outlier. Diagnostic tool: leverage.
- An individual point have large impact on
 . Diagnostic tool:
DFFITS.

- An individual point may have large impact on
 (the whole vector).
Diagnostic tool: Cook's distance.

- Can be computed without deleting case from

- To judge size compare to
 (lower tail area is 10%, usually found as
1 over upper 10% point of
  ) and to
 . Bigger than latter is
quite serious. Smaller than former is good.
Between is gray zone.
- An individual point may have large impact on
 .
Diagnostic tool: DFBETAS.

Same guidelines as DFFITS; software not always set up to compute DFBETAS.
Problems with modelling assumptions
- The assumption of homoscedastic errors may be poor.
- Split data set into 2 parts on basis of covariates and
fit regressions in each part separately. Do 2 sample t-test
on mean absolute size of residuals.
See page 112 in text for modified Levene test.
- Regress squared fitted residual on covariate or covariates
and test for non-zero
slope. Breusch-Pagan test; see page 115.
- The assumption of normality may be wrong. Diagnostic tool:
Shapiro-Wilk test applied to residuals or correlation test in Q-Q plot.
- There may be interaction effects or effects not linear in the
covariates. Possible techniques: added variable plot, pure error sum of
squares F-test.
Pure error sum of squares.
If there are several observations at each combination of covariate values
you can fit a model which has one parameter for each such combination of
values. This is just a one way analysis of variance model which has
a mean parameter for each cell, that is, for each combination of
covariates. The fitted model and this one way ANOVA model are compared by
an extra sum of squares F-test.
Added Variable Plots or partial regression plots
Plot residuals from fitted model against residuals of possible other
covariate regressed against same covariates as in current model.
I use SAS to fit the final selected model: covariates used are
STAY, CULTURE, NURSES, NURSE.RATIO.
options pagesize=60 linesize=80;
data scenic;
 infile 'scenic.dat' firstobs=2;
 input Stay  Age Risk Culture Chest Beds School Region Census Nurses Facil;
 Nratio = Nurses / Census  ;
proc glm  data=scenic;
  model Risk = Culture Stay Nurses Nratio ;
  output out=scout P=Fitted PRESS=PRESS H=HAT RSTUDENT =EXTST R=RESID DFFITS=DFFITS COOKD=COOKD;
run ;
proc print data=scout;
Complete SAS Output is
here.
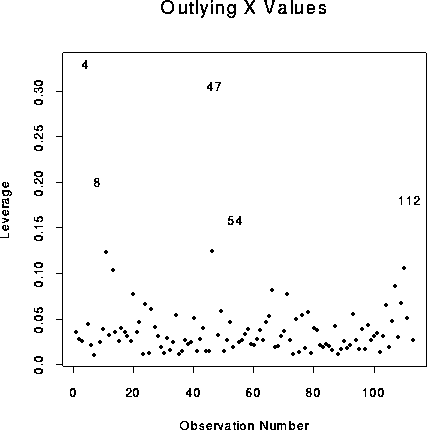
Here is a plot of the leverages against the observation number. (The
text calls a plot in which one variable is the observation number an
"index" plot.)

We find that observations 4, 8, 47, 54 and 112
have leverages over 0.15 (many more are over 10/113 the suggested cut off -
I prefer to plot the leverages and look at the largest few).
Observations 4 and 47, in particular, have leverages over 0.3 and should be
looked at.
Now I look at influence measures.
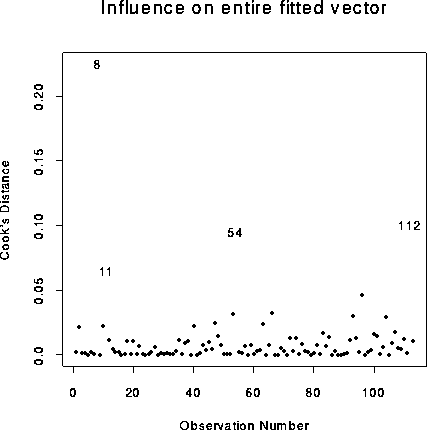
COOK'S DISTANCE
In this plot observations 8, 11, 54 and 112
have values of  larger than 0.05. Of these, only observation 11
is new. The text recommends worrying only about observations for which
 is larger than the tenth to twentieth percentile of the
  distribution. In this case those critical points are 0.3? and 0.46. None
of the observations exceeds even the lowest of these numbers.
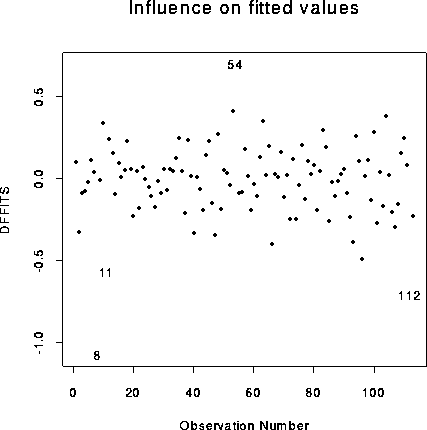
DFFITS
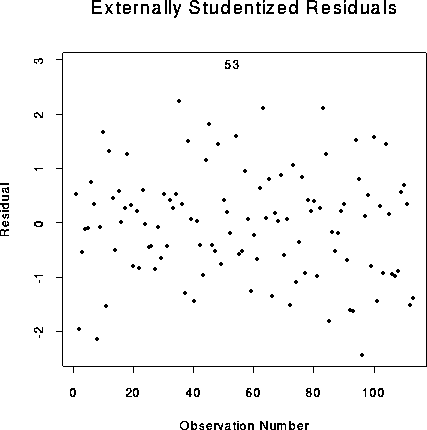
Finally case deleted residuals:
Notice that only observation 53 is added for our consideration, though
with 113 residuals a value of 2.9 is not terribly unusual.
Here are the covariate values for observations 4, 8, 11, 47, 53, 54 and 112:
|
Observation | Culture | Stay | Nurses | Nratio | Risk |
|
4 | 18.9 | 8.95 | 148 | 2.79 | 5.6 |
|
8 | 60.5 | 11.18 | 360 | 0.90 | 5.4 |
|
11 | 28.5 | 11.07 | 656 | 1.11 | 4.9 |
|
47 | 17.2 | 19.56 | 172 | 0.63 | 6.5 |
|
53 | 16.6 | 11.41 | 273 | 0.83 | 7.6 |
|
54 | 52.4 | 12.07 | 76 | 0.66 | 7.8 |
|
112 | 26.4 | 17.94 | 407 | 0.51 | 5.9 |
|
Mean | 15.8 | 9.65 | 173 | 0.95 | |
|
SD | 10.2 | 1.91 | 139 | 0.11 |
|
                                     Sum of            Mean
Source                  DF          Squares          Square   F Value     Pr > F
Model                    4     100.46168102     25.11542026     28.21     0.0001
Error                  105      93.49504625      0.89042901
Corrected Total        109     193.95672727
                  R-Square             C.V.        Root MSE            RISK Mean
                  0.517959         21.87080       0.9436255            4.3145455
                                        T for H0:    Pr > |T|   Std Error of
Parameter                  Estimate    Parameter=0                Estimate
INTERCEPT              -.1511778299          -0.21     0.8349     0.72370376
CULTURE                0.0568635139           5.28     0.0001     0.01077276
STAY                   0.2773500736           4.18     0.0001     0.06629165
NURSES                 0.0016666813           2.30     0.0232     0.00072362
NRATIO                 0.7024480620           1.92     0.0578     0.36620665
Compare these results to the corresponding parts of the same code applied
to the full data set.
Dependent Variable: RISK
                                     Sum of            Mean
Source                  DF          Squares          Square   F Value     Pr > F
Model                    4     103.69052272     25.92263068     28.66     0.0001
Error                  108      97.68930029      0.90453056
Corrected Total        112     201.37982301
                  R-Square             C.V.        Root MSE            RISK Mean
                  0.514900         21.83920       0.9510681            4.3548673
                                        T for H0:    Pr > |T|   Std Error of
Parameter                  Estimate    Parameter=0                Estimate
INTERCEPT              -.0831378994          -0.14     0.8917     0.60917500
CULTURE                0.0482485831           5.03     0.0001     0.00959016
STAY                   0.2767441333           5.04     0.0001     0.05489077
NURSES                 0.0015865156           2.26     0.0258     0.00070177
NRATIO                 0.7694874096           2.57     0.0115     0.29939874
SUMMARY
The differences seem minor so there is little harm in just sticking to
the model fitted at the start of these notes.


Richard Lockhart
Fri Feb 28 09:46:53 PST 1997
 is diagonal entry in H the hat matrix.
 and
and  so
so  .
. average to p/n.
 is "large" leverage.
 is large,
  is moderately large.

 . Thus can be computed without actually deleting case i
and rerunning.
 in small to medium
data sets or for
  in large data sets.

 (lower tail area is 10%, usually found as
1 over upper 10% point of
  ) and to
 . Bigger than latter is
quite serious. Smaller than former is good.
Between is gray zone.


