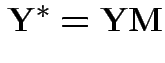
 ; covariate
 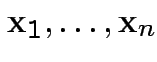 (each written as row vector).
Univariate case:
Data:
; covariate ![]() -vectors
(each written as row vector).
-vectors
(each written as row vector).
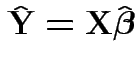
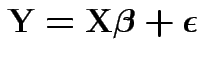
Model
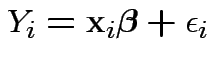
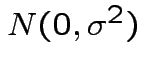 errors
 (column) vector.
Commonly: first entry in each ![]() is 1;
corresponding
is 1;
corresponding ![]() is "intercept". In text:
use
is "intercept". In text:
use  for
for ![]() so that
so that ![]() is number of coefficients
other than intercept.
is number of coefficients
other than intercept.
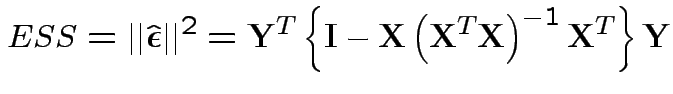
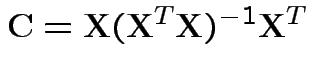
Model fitting: Maximum Likelihood = Least squares.
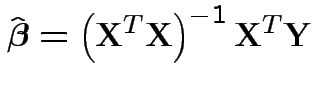
 , entries
  with
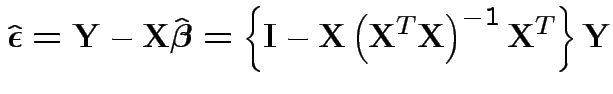
with Fitted response vector
Fitted residual vector
What sort of hypotheses can we test:

 matrix of constants
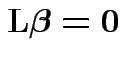
Example: Test all ![]() but
but ![]() are 0:
are 0:
![$\displaystyle {\bf L}= \left[ {\bf0}_{(r-1)\times 1} \vert {\bf I}_{r-1 \times r-1}\right]
$](img25.gif)
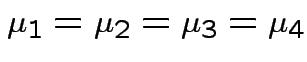
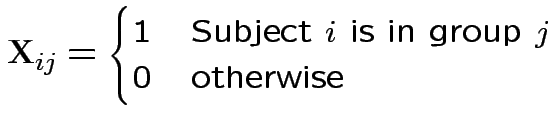
Example: One way ANOVA with ![]() groups:
groups: ![]() has
has ![]() columns.
Entry
columns.
Entry ![]() for observation
for observation ![]() is 1 or 0 according as case number
is 1 or 0 according as case number
![]() belongs to group
belongs to group ![]() or not. For our data on 3 test scores:
or not. For our data on 3 test scores:
![$\displaystyle {\bf X}= \left[\begin{array}{cccc}
1 & 0 & 0 & 0
\\
\vdots & \vdots & \vdots & \vdots
\\
0 & 0 & 0 & 1
\end{array}\right]
$](img28.gif)
 could use
![$\displaystyle {\bf L}= \left[\begin{array}{rrrr}
1 & -1 & 0 & 0 \\ 1 & 0 & -1 & 0 \\ 1 & 0 & 0 &-1
\end{array}\right]
$](img30.gif)
![$\displaystyle {\bf L}= \left[\begin{array}{rrrr}
1 & -1 & 0 & 0 \\ 0 & 1 & -1 & 0 \\ 0 & 0 & 1 &-1
\end{array}\right]
$](img31.gif)
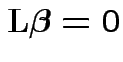
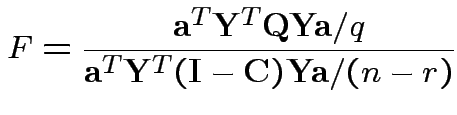
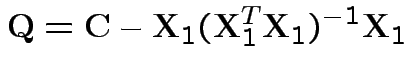
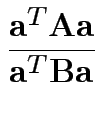
To test
 :
:
Fit model twice:
Full model: get Error sum of squares:
Restricted model: minimize
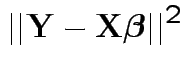
 .
.
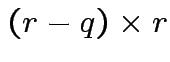
Method: assume rank of ![]() is
is  . (Full rank.)
Find
. (Full rank.)
Find ![]() a
a
 so that
![$\displaystyle {\bf P}=\left[\begin{array}{l} {\bf L}^* \\ {\bf L}\end{array}\right]
$](img39.gif)
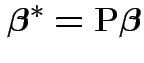
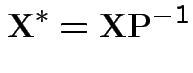
Model is
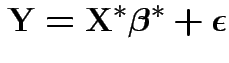
 and
and
Then


![]() test based on
test based on
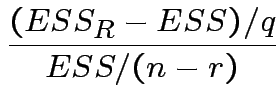
 distribution on null.
Multivariate Case
Now
distribution on null.
Multivariate Case
Now  . Write model
 .
.
Model for errors: rows are iid
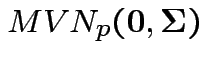 .
.
NOTE: fitting same regression model to each different response variable but with errors correlated.
Least squares estimates: as before
Fitted response matrix
Fitted residual matrix
What sort of hypotheses can we test:

Example: Back to one way manova profile analysis:
Design matrix ![]() has entries
has entries
Matrix
![]() has row
has row ![]() equal to
equal to
 .
Number of rows = number of groups, number of columns = number of response
variables.
.
Number of rows = number of groups, number of columns = number of response
variables.
Hypotheses of interest:
1) Parallel profiles:
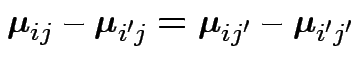
 . Do case of 4 groups and 3 variables. So
 :
:
![$\displaystyle {\bf M}= \left[\begin{array}{rr} 1 & 1 \\ -1 & 0 \\
0 & -1 \end{array}\right]
$](img65.gif)
2) Coincident profiles:
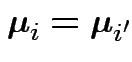 for
all
for
all ![]() and
and ![]() . Now
. Now ![]() is the identity and
is the identity and ![]() is
as above.
is
as above.
3) Constant profiles: ![]() is the identity,
is the identity, ![]() as above.
as above.
Testing
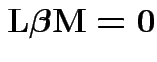 .
.
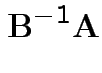
1) Multiply model equation by ![]() . Get
. Get

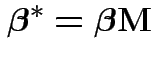
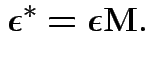 .
.
2) So now: drop ![]() s and discuss test of
. Reparametrize again as in univariate:
Find
s and discuss test of
. Reparametrize again as in univariate:
Find ![]() a
a
 so that
Model is
 and
and
 .
.
Then
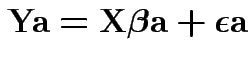
3) Again drop ![]() s and discuss test of
s and discuss test of
 in model
![$\displaystyle {\bf Y}= \left[{\bf X}_1 \vert {\bf X}_2\right]\left[\begin{array...
...oldsymbol\beta_1 \\ \boldsymbol\beta_2\end{array}\right]
+\boldsymbol\epsilon
$](img79.gif)
Union Intersection Principle:
if and only if
 for all
 vectors
 ![]() . So multiply
model equation by
. So multiply
model equation by ![]() get
get
Get corresponding ![]() statistic:
statistic:
I.e. maximize ![]() over
over ![]() .
.
Maximize
 :
:
Solution for ![]() not singular is largest eigenvalue of
not singular is largest eigenvalue of
Example: MANACOVA: 45 patients, 4 groups (defined by body type and obesity status).
Record 4 biochemical measurements on urine of each subject: three response variables, one covariate: specific gravity of the urine.
Compare groups adjusting for specific gravity.
run;
    data long;
    infile 'dq5.1';
    input group creatin chloride choline specgrav;
run;
proc print;
run;
proc glm;
    class group;
    model creatin chloride choline = group|specgrav;
    manova h= group*specgrav / printh printe;
run;
proc glm;
    class group;
    model creatin chloride choline = group specgrav;
    manova h= group / printh printe;
    means group / bon scheffe tukey;
run;
proc glm;
    class group;
    model creatin chloride choline = group;
    manova h= group / printh printe;
    means group / bon scheffe tukey;
run;
Begin by examining group by specific gravity
interaction:
Characteristic Roots and Vectors of:
      E Inverse * H, where
H = Type III SS&CP Matrix for SPECGRAV*GROUP
E = Error SS&CP Matrix
Manova Test Criteria and F Approximations for
the Hypothesis of no Overall SPECGRAV*GROUP Effect
S=3    M=-0.5    N=16.5
Statistic        Value     F NumDF DenDF Pr > F
Wilks' Lambda   0.6153 2.0939  9   85.33 0.0387
Pillai's Trace  0.3899 1.8426  9    111  0.0683
Hotg-Lly Trace  0.6167 2.3070  9    101  0.0211
Roy's Greatest  0.6026 7.4320  3     37  0.0005
NOTE: F Statistic for Roy's Greatest Root
     is an upper bound.
The group by specific gravity interaction appears to be
marginally significant so that adjusting for specific gravity
comparisons is difficult.
In what follows we ignore the possibility of any such interaction.
Look at model with no interaction term:
MANOVA Test Criteria and F Approximations for the
Hypothesis of No Overall group Effect
H = Type III SSCP Matrix for group
E = Error SSCP Matrix
S=3    M=-0.5    N=18
Statistic       Value  F  NumDF Den DF Pr > F
Wilks' Lambda  0.5972 2.43  9   92.633 0.0159
Pillai's Trace 0.4398 2.29  9      120 0.0208
Hotg-Lly Trace 0.6127 2.54  9   56.616 0.0159
Roy's Greatest 0.4877 6.50  3       40 0.0011
NOTE: F Statistic for Roy's Greatest Root is
an upper bound.
Conclusion: Pretty clear evidence of differences between groups. Should examine simultaneous confidence intervals. In same model: do we need covariate?
MANOVA Test Criteria and Exact F Statistics for the
Hypothesis of No Overall specgrav Effect
H = Type III SSCP Matrix for specgrav
E = Error SSCP Matrix
S=1    M=0.5    N=18
Statistic      Value   F  NumDF DenDF Pr > F
Wilks' Lambda  0.420 17.51  3    38   <.0001
Pillai's Trace 0.580 17.51  3    38   <.0001
Hotg-Lly Trace 1.382 17.51  3    38   <.0001
Roy's Greatest 1.382 17.51  3    38   <.0001
So covariate is significant. But what if we had not measured it?
MANOVA Test Criteria and F Approximations for the
Hypothesis of No Overall group Effect
H = Type III SSCP Matrix for group
E = Error SSCP Matrix
S=3    M=-0.5    N=18.5
Statistic     Value   F  NumDF DenDF  Pr > F
Wilks' Lambda  0.608 2.40  9   95.066 0.0171
Pillai's Trace 0.431 2.30  9  123     0.0203
Hotg-Lly Trace 0.580 2.47  9   58.185 0.0185
Roy's Greatest 0.434 5.93  3   41     0.0019
NOTE: F Statistic for Roy's Greatest Root is
an upper bound.
Same conclusion: difference in group means. Why is specgrav needed in model but irrelevant to conclusions? No real differences between groups in terms of specgrav
   data long;
    infile 'dq5.1';
    input group creatin chloride choline specgrav;
run;
proc glm;
    class group;
    model specgrav = group ;
run;
which gives
The GLM Procedure
Dependent Variable: specgrav
             Sum of
Source  DF  Squares MeanSquare F   Pr > F
Model    3  120.30  40.100241 1.19 0.3269
Error   41 1386.28  33.811636
Corrd   44 1506.58
Adjustment for covariates:
Suppose ![]() is a covariate and
is a covariate and ![]() a response. In order to
compare the effect of a treatment on
a response. In order to
compare the effect of a treatment on ![]() we might have a treatment
and a control group.
we might have a treatment
and a control group.
Example: ![]() is blood pressure before and
is blood pressure before and ![]() is blood pressure
after treatment (real or placebo depending on group).
is blood pressure
after treatment (real or placebo depending on group).
Both ![]() and
and ![]() must be regarded as random in this example.
must be regarded as random in this example.
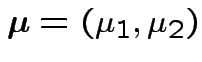
Models:  has BVN
 distribution with
![]() and
and
![]() which depend on whether the subject is in treatment or control.
which depend on whether the subject is in treatment or control.
Control group:
![$\displaystyle {\boldsymbol\Sigma}= \left[\begin{array}{cc}\sigma_1^2 & \rho\sigma_1\sigma_2 \\ \rho\sigma_1\sigma_2 & \sigma_2^2
\end{array}\right]
$](img99.gif)
Treatment group:
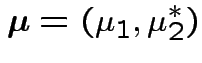
![$\displaystyle {\boldsymbol\Sigma}= \left[\begin{array}{cc}\sigma_1^2 & \rho^*\sigma_1\sigma_2^* \\ \rho\sigma_1\sigma_2^* & (\sigma_2^*)^2
\end{array}\right]
$](img101.gif)
If we knew parameters how would we summarize treatment effect?
No easy way. Simplifying assumptions: several possible.
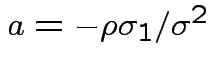
Usual: Equal covariance matrices. Treatment effect is
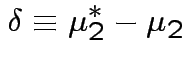
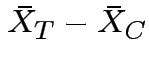
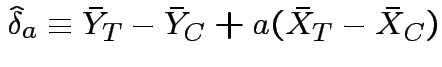
Variance is
![$\displaystyle \left(\frac{1}{n_T}+\frac{1}{n_C}\right)
\left[ \begin{array}{cc}...
...right]
{\boldsymbol\Sigma}
\left[ \begin{array}{c} 1 \\ a \end{array} \right]
$](img107.gif)
 ; variance becomes

Other treatment effect models?
Effect of treatment: ``after'' measurement is
 effect.
Could assume ![]() and
and  independent. (Not too realistic.)
Could ask: what does joint  distribution have to be to
get same as previous model.
distribution have to be to
get same as previous model.
Potential problem: joint distribution of not
estimable from this experimental design.