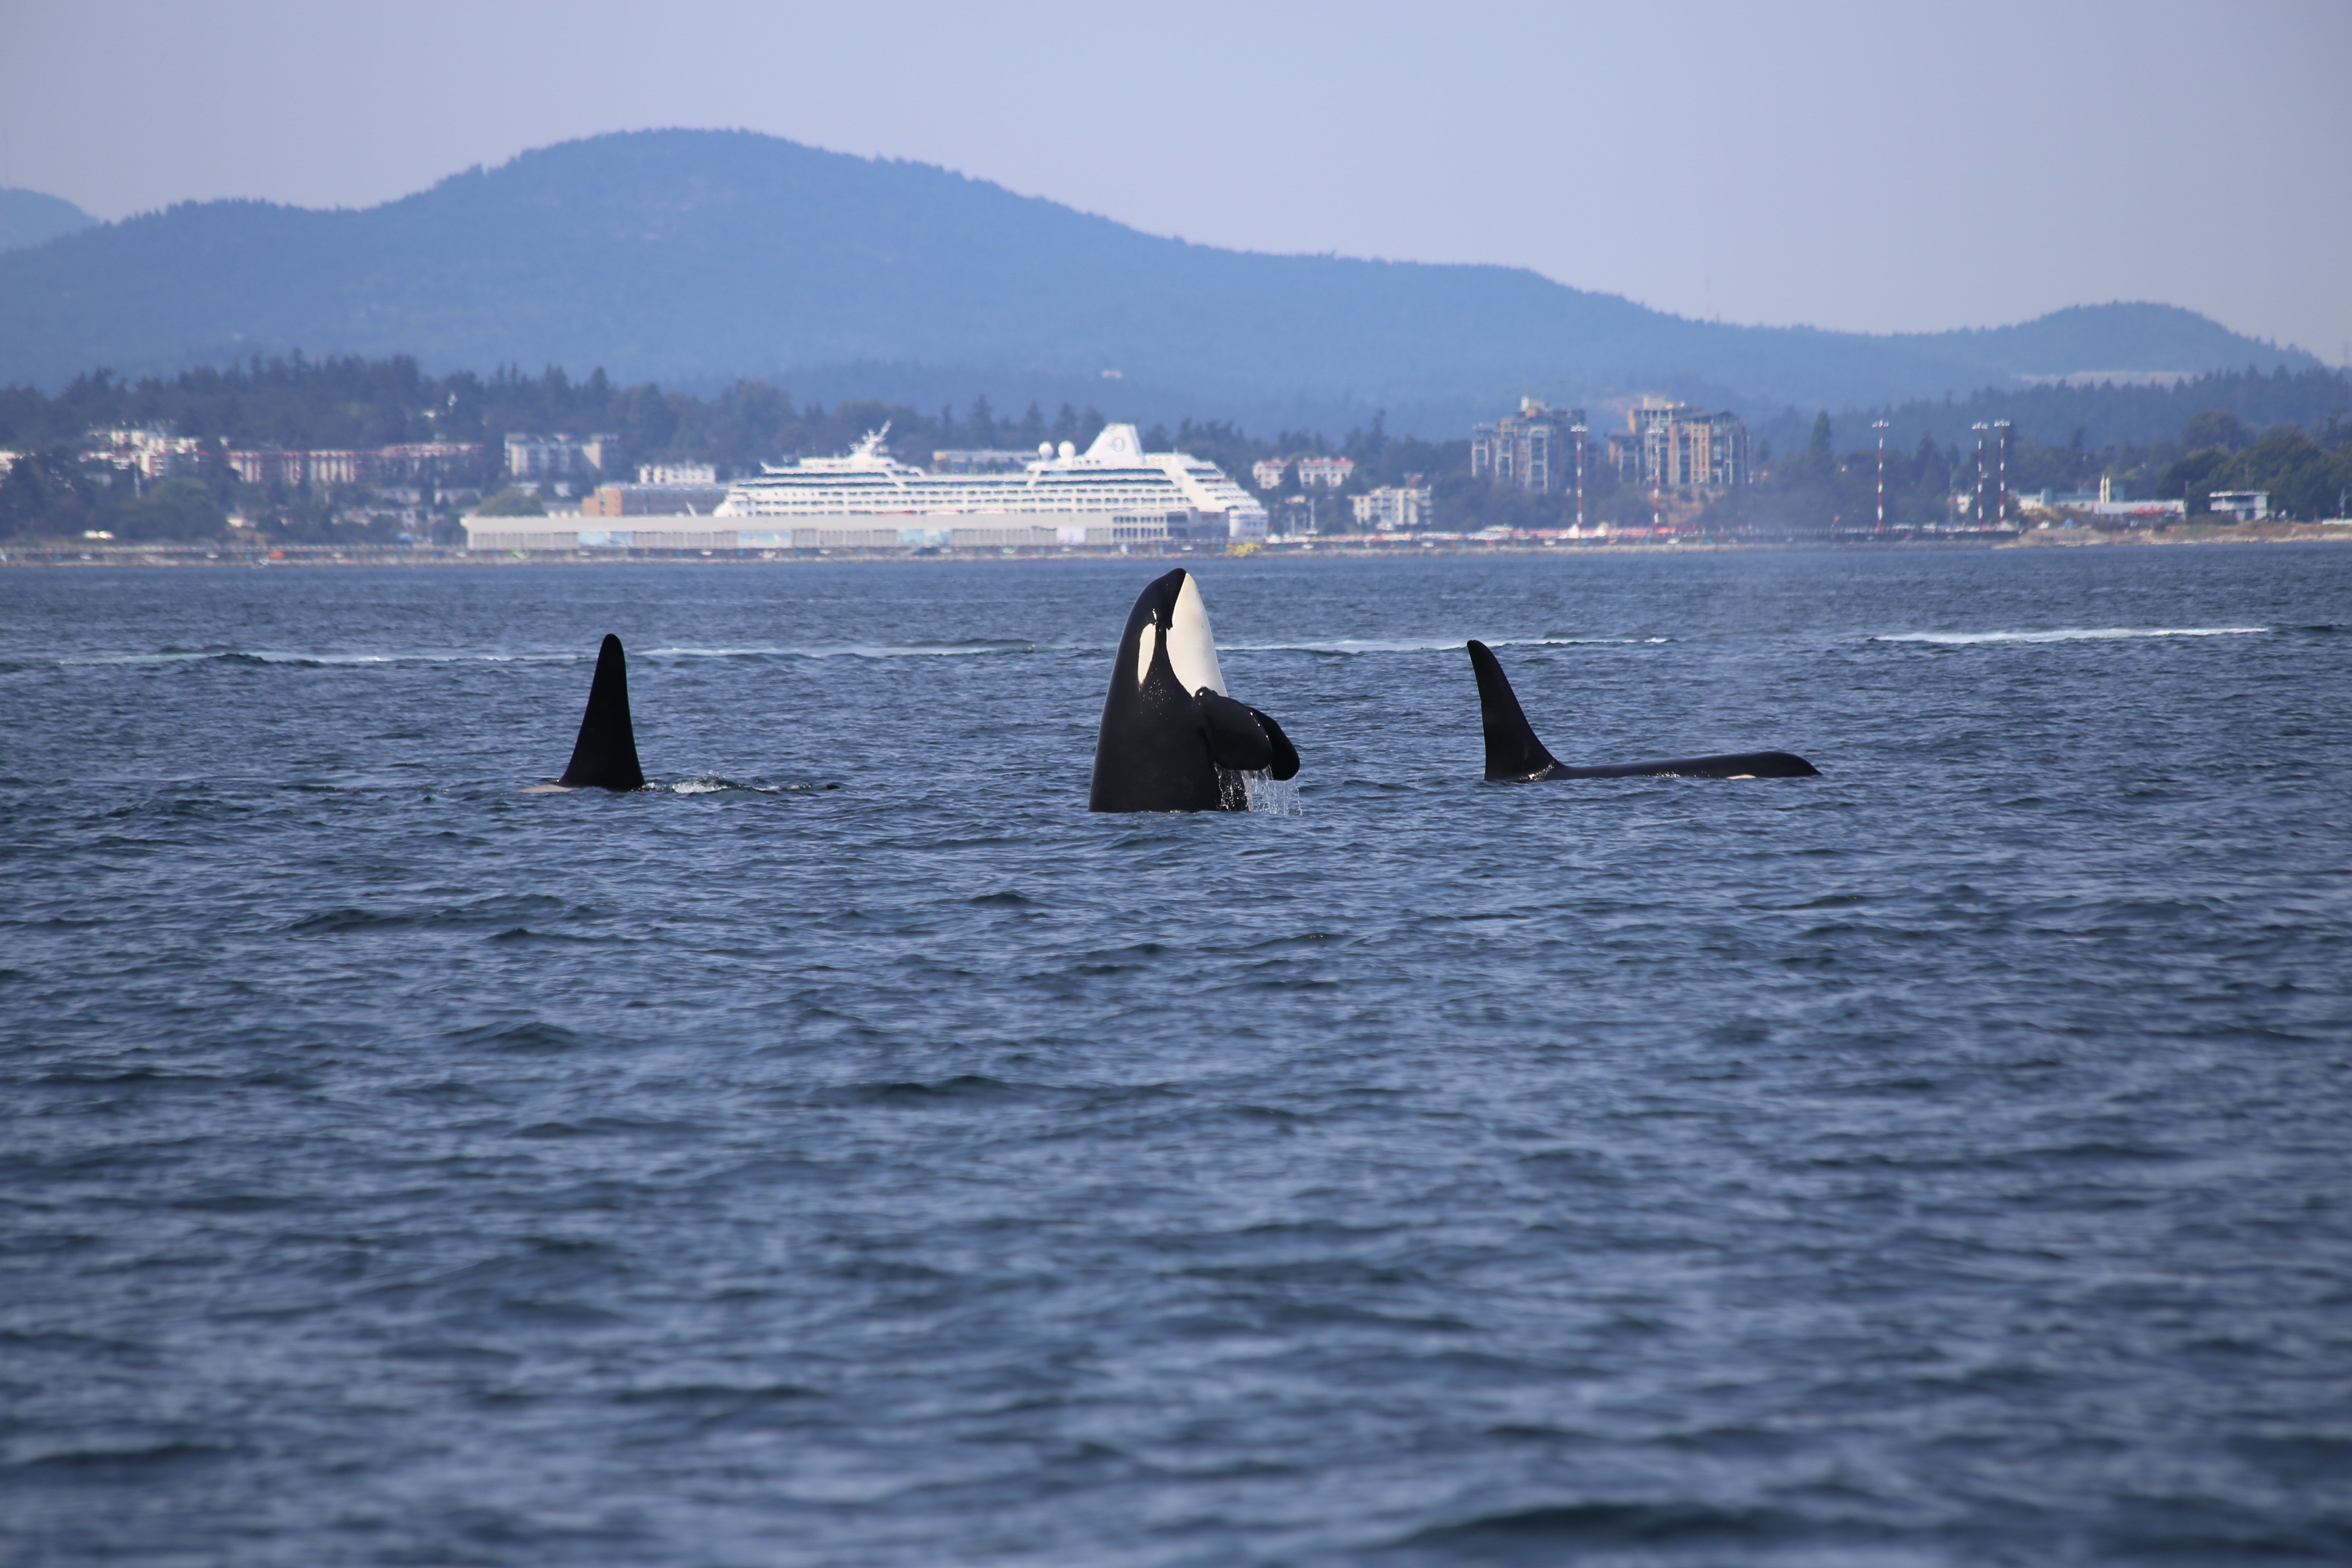
Photo credit: Dick Martin (Unsplash)
Imagine you are on a sailing boat in the Salish Sea, enjoying a sunny day. Now have a look around you. You may notice that the area is quite busy with vessels. In the background you may spot tankers, ferries, or cargos. If you are lucky, you may also sight whale blows, dorsal fins, or tails in your vicinity. In fact, marine traffic is growing in the Salish Sea and with this comes an increase in the risk of whales being struck by vessels. This threat is especially alarming for the endangered Southern Resident Killer Whales (SRKW), with less than 80 individuals remaining. Then, it is vital to limit the overlap between whales and vessels so that they can coexist without any risk of injury or death. Together with Dr. Ruth Joy and Prf. Michael Dowd, we are developing a new tool for predicting in real-time the future SRKW positions and trajectories. We aim to predict the whale locations a few hours in advance to allow ship pilots to adjust their path and reduce their speed. Our system is a statistical framework inspired by numerical weather forecasting. For instance, meteorologists use real-time environmental information to forecast storm or cyclone trajectories. Similarly, our system ingests real-time sightings of SRKW from experts in the field, as well as underwater acoustic detections and environmental data. The output consists of maps of probabilities of SRKW presence for the coming hours. We expect this tool will help mitigating collision risk between SRKW and commercial vessels.
For a summary of the statistical framework and application, you can look at our poster:
Who are the Southern Resident Killer Whales?
Along the coastal waters of the Pacific Northwest, several killer whales (Orcinus orca) populations are found.
Three ecotypes are distinguished, the transient ("Bigg's"), the Northern and Southern resident killer whales (SRKW).
SRKW inhabit the straits between Vancouver Island, southern British Columbia and northern Washington State, an area called the Salish Sea.
SRKW are present year-round in the Salish Sea, with the eastern region of Haro Strait (between Vancouver Island and San Juan Island) considered the core of their critical habitat.
SRKW feed on Chinook salmon (Oncorhynchus tshawytscha), especially in Spring and Summer when salmon migrates back to the rivers to reproduce [1-2].
SRKW are separated in three pods (stable social units) J, K and L that interact together regularly.
These pods differ in some features like their group size [3], social structure [4], habitat occupancy [3,5,6] and dialect [7-8].
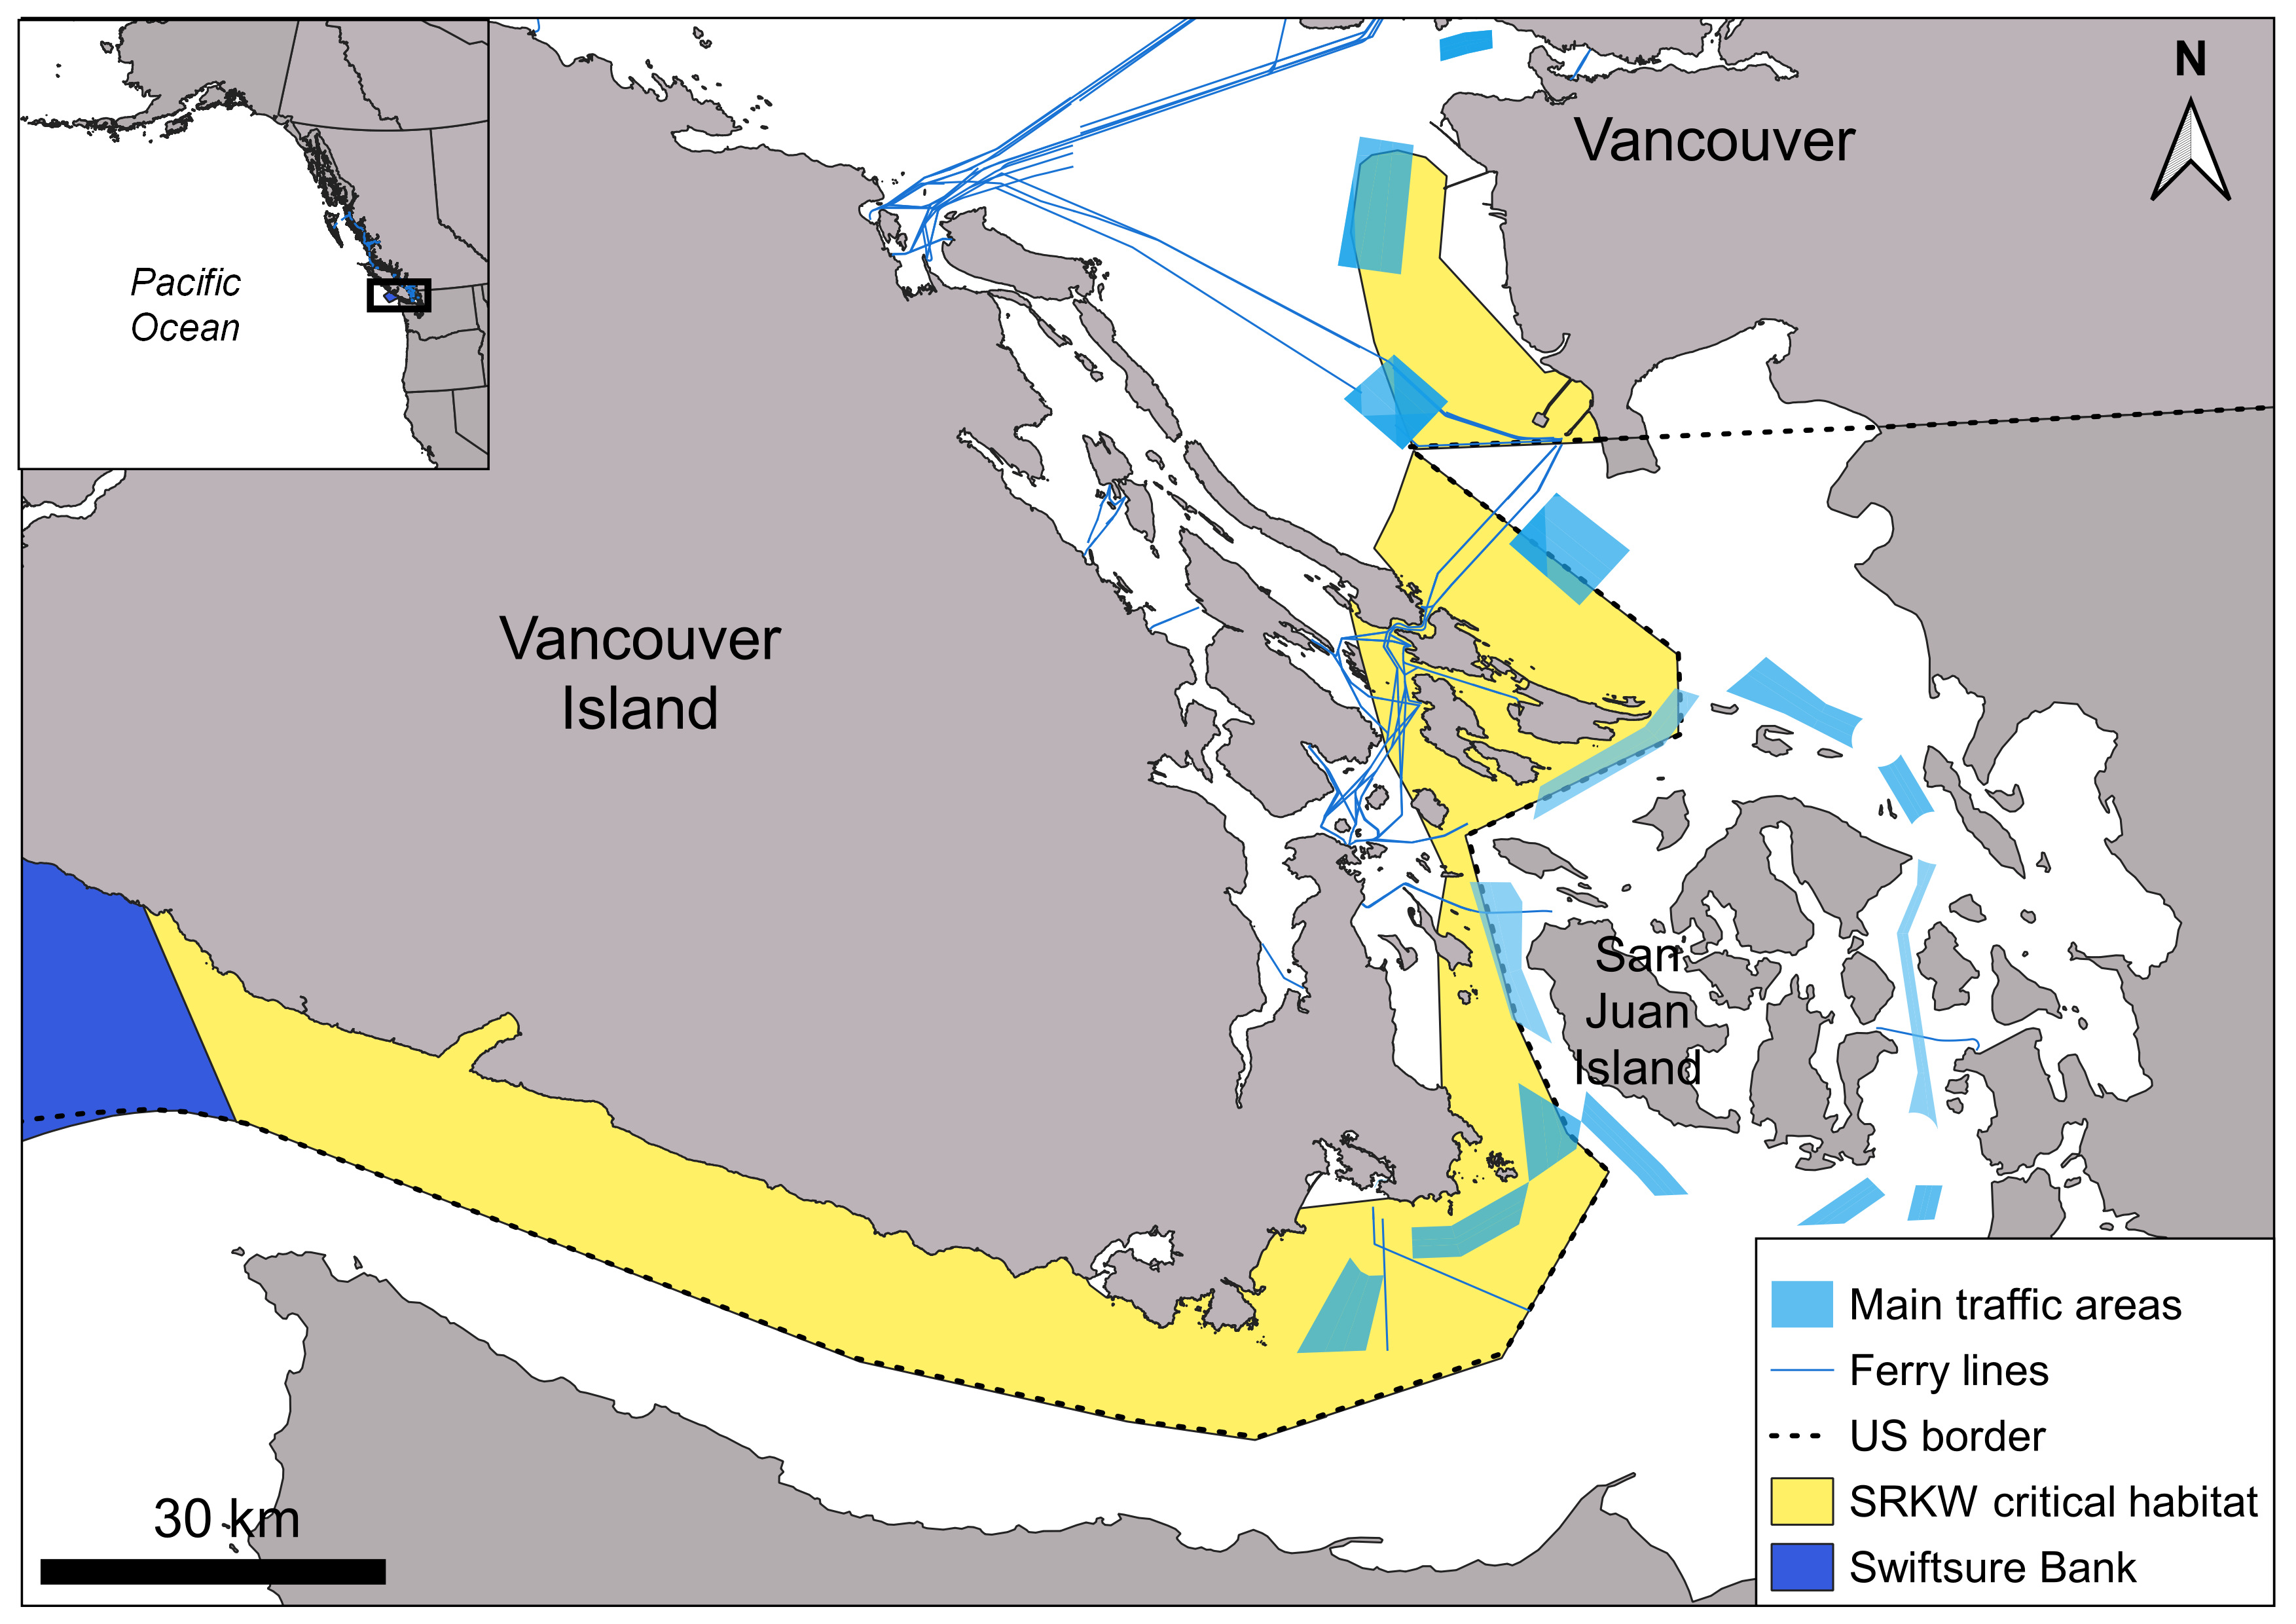
Map of the Salish Sea showing the overlap between SRKW critical habitat in Canadian waters and the main shipping lanes
Why do we have to protect them?
Prior to the 20th century, the SRKW population might has been composed of around 200 individuals [9].
Unfortunately, a dramatic decline was observed over the last decades.
Only 73 individuals were recorded as of December 2019.
The SRKW population has been listed as Endangered in Canada since 2003.
In the United States in 2005 the SRKW population was designated under the Endangered Species Act (ESA) [9].
Such a dramatic decline might be explained by numerous and complementary factors [10], mainly related to human activities:
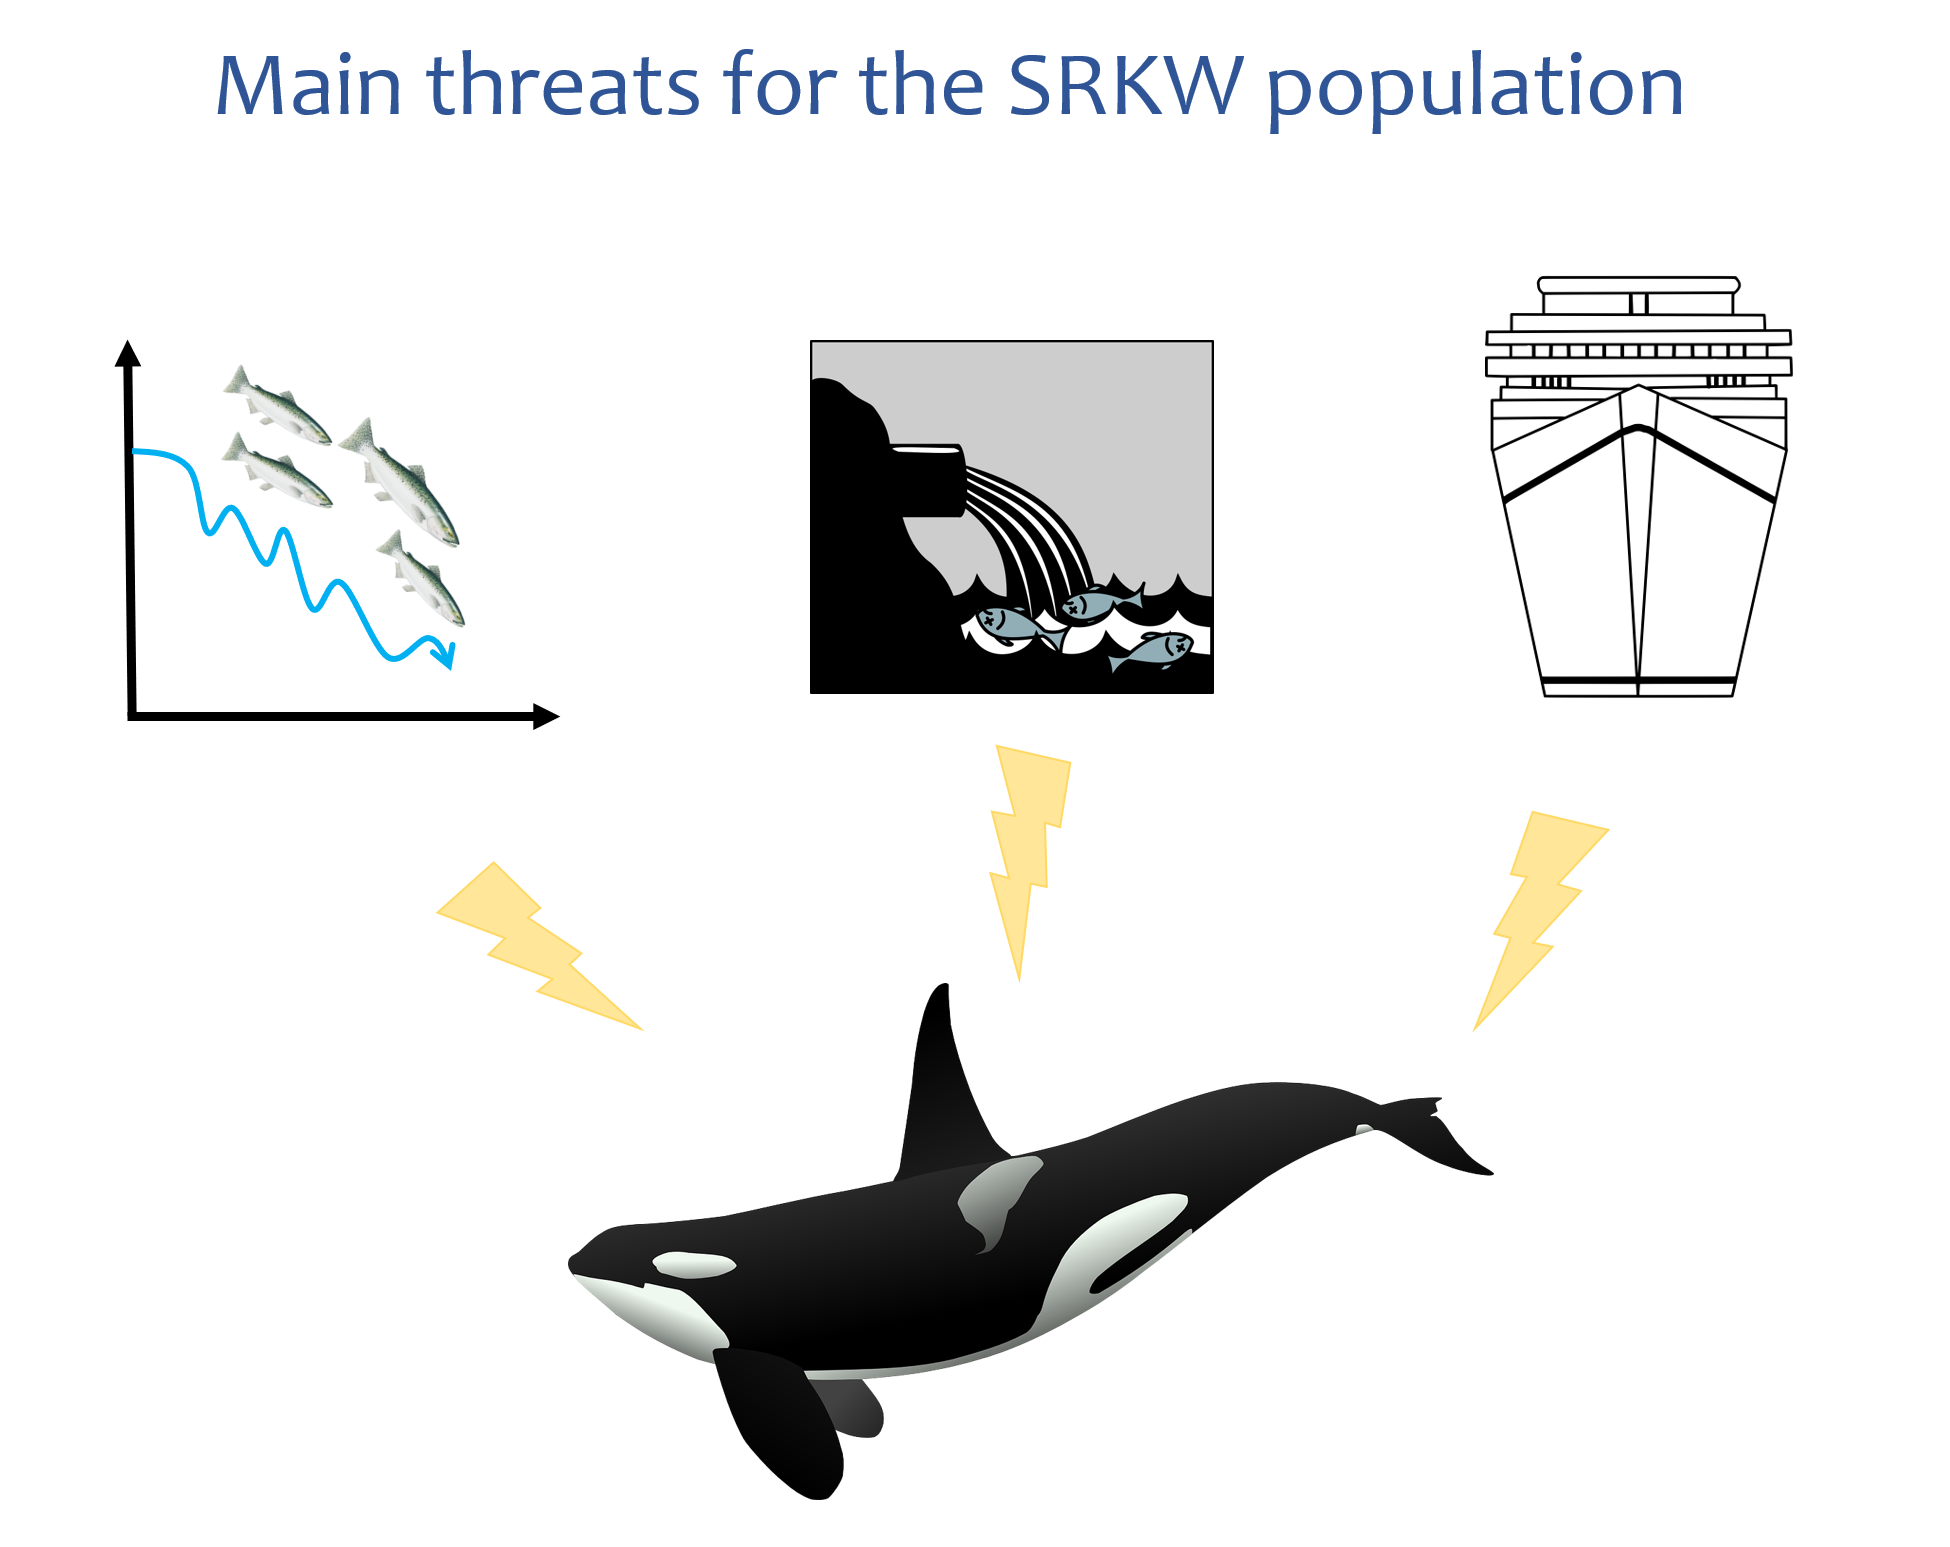
- A decline in Chinook salmon abundance, due to overfishing and habitat destruction, may limit SRKW growth and reproduction capacity [1,2,11]. The modern carrying capacity might be around 90 whales in the Salish Sea [12], which means that other factors may drive the SRKW population decline.
- Contaminants are a threat that exacerbates the decline in prey abundances. As top predators feeding mostly on salmon, SRKW accumulate persistent organic pollutants in their fatty tissues, affecting their survival and reproduction [13].
- The overlap between the SRKW critical habitat and major international shipping lanes is another concern. The growing shipping traffic in the Salish Sea and the recent industrial development plans (port expansion, oil pipeline terminal) are direct threats for SRKW [14-16]. Sound disturbance and collision with ships directly impact the behavior and survival of these endangered whales.
Our project aims to develop a whale collision avoidance tool using a real-time forecasting system of SRKW trajectories
How a real-time forecasting system can help?
Using multiple data sources of varying quality and resolution,
we aim to develop an advance warning system to commercial ship pilots. If operators of transiting ships were aware in real-time
of the location and probability of whales moving into or towards their path, a significant proportion of collisions could
be removed if ships reduced their speed [17] or adjusted their path.
In practice, we develop the methodological framework for a stochastic movement forecast model that is updated as data becomes
available to provide real-time SRKW pod locations and probabilistic predictions of direction of movement.
What are the data?
Here we propose to use near-real time data and historical information in two different ways to predict in real-time the pod locations. Near-real time data are available every day (or half-day) whereas historical data are available at larger scale (month or season). Taken together, these data of various resolutions have the potential to accurately inform on past and present whale locations.
Near-real time data
In our case, sighting and acoustic information will inform the real-time pod locations.
- Sightings are recorded by whale watching industry and other expert observers. They are reported in real-time through various existing Apps. These data are expected to be irregular in time, with redundant information, and effort concentrated in whale watching season and in areas frequented by observers. Nevertheless, sightings are expected to provide the core information to guide the forecasting system.
- Acoustic data provide presence information recorded by several hydrophone nodes deployed in the Salish Sea. The underwater listening stations carry out passive acoustic monitoring of SRKW locations. The position attached to the observation will be at the center of a region (listening envelope) of whale presence. The size of this region is expected to change with oceanographic conditions and the underwater noise level. False positives and false negatives are detection errors that should be considered. In parallel to this project, a machine learning framework will be developed in order to distinguish vocalisations from different killer whale ecotypes (transient vs resident) and pods.
Historical data
Historical data is indirect information of pod locations such as environmental variables (e.g. water temperature, bathymetry, chlorophyll) and/or species distribution (historical whale density maps and eventually salmon information). This information is essential to predict the whale locations, especially when other real-time information is not available. Imagine a rainy day with no whale watching activity. How can we feed the model without any direct information of pod locations? This is the role of historical data.
- Bathymetry corresponds to the underwater topography and coastlines. This information is essential for the model since the Salish Sea geometry is complex with many islands that must be considered in the movement predictions.
- Biophysical oceanographic variables (temperature, salinity, currents, tides, phytoplankton and zooplanktons) may act as proxies for key variables like prey field (i.e. Chinook salmon). Potential links between these variables and the SRKW movement must be attempted.
- Chinook salmon is the primary prey for SRKW [1,2,11]. It is expected that much of the SRKW movements in the Salish Sea are in response to their search activity for Chinook salmon. Information on Chinook abundance, spatial distribution and phenology would be key for SRKW forecasting.
- Historical SRKW density maps (past spatial and temporal distribution of SRKW) are extremely important for the movement model, both as a direct driver and a reality check. Based on a distribution model of SRKW, Dr. Joe Watson from UBC has provided monthly (May – October) SRKW pod distributions [6]. This information is precious and must be integrated in the movement model.
How to build a forecasting system?
The underlying movement model
The movement model behind a real-time forecasting system is a directional correlated random walk. In other words, the random walk allows to estimate the pod locations at time t using the former locations at time t-1 and a random noise. This model is pod-specific because J, K and L pods are distinct whale groups having different habitat occupancy [3,5,6]. Moreover, we build the model in two dimensions so that the positions are estimated in latitude and longitude.
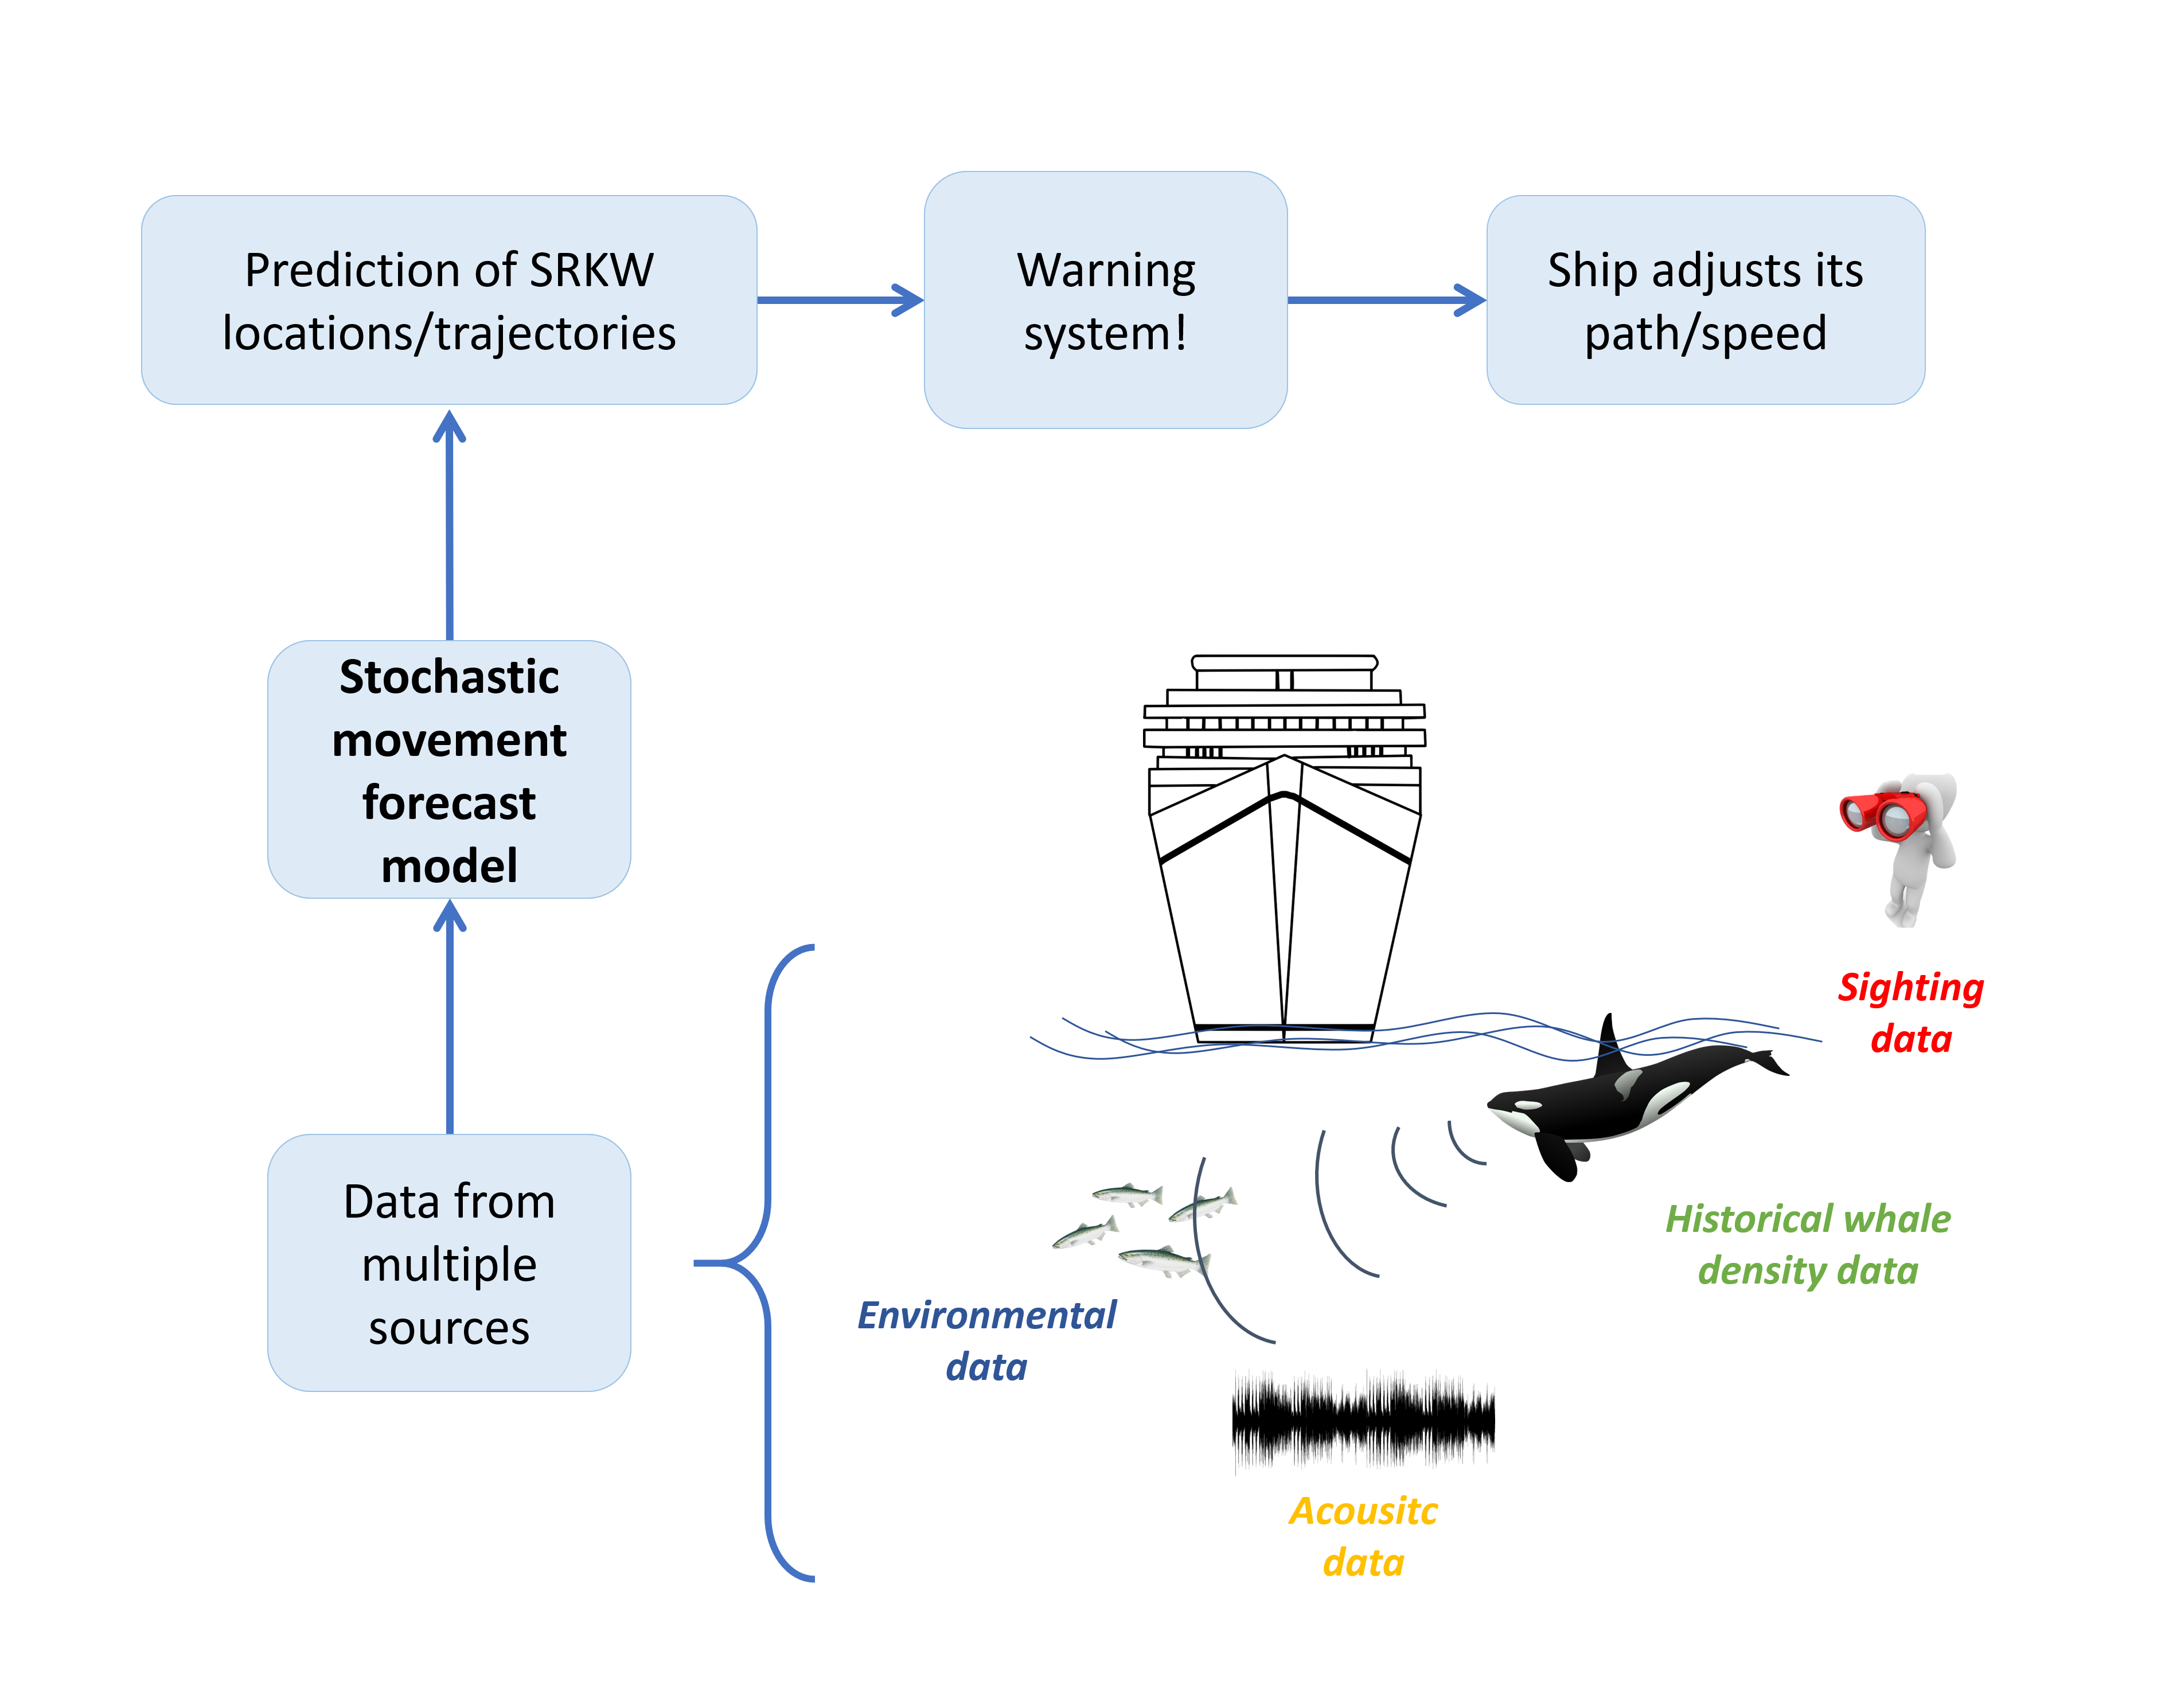
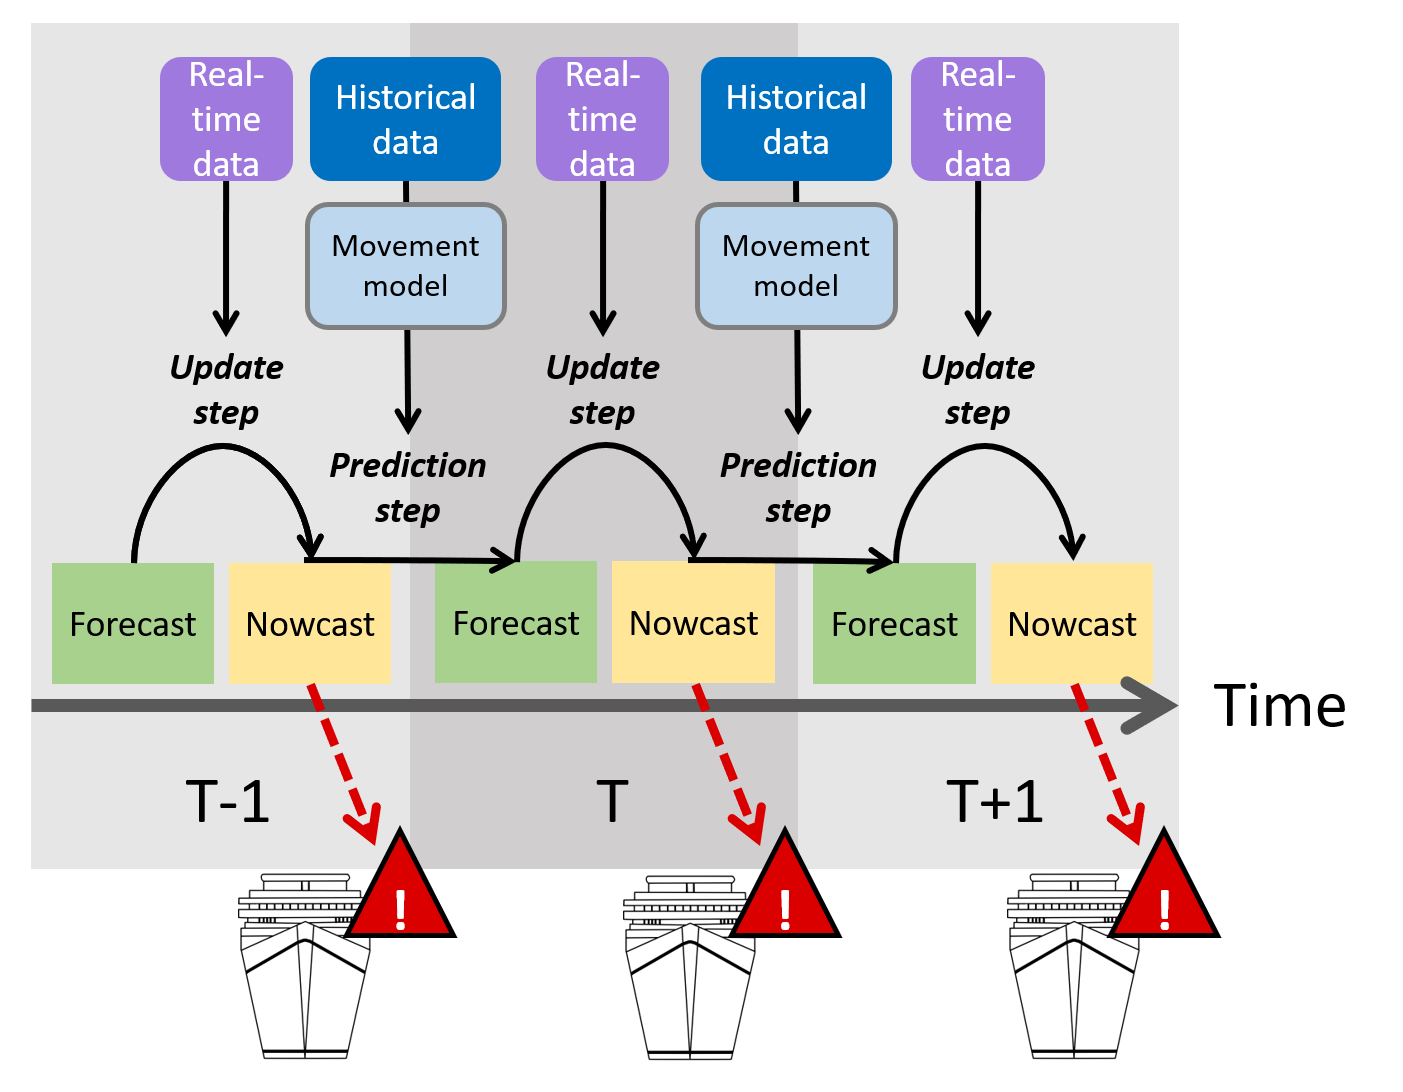
Overview of the forecasting system
The forecasting system uses the movement model and the data to produce an estimate of pod locations at each time step. Here a time step might be something like a day or half-day. Two steps compose the forecasting system: the forecast and the nowcast steps. The forecast step is the final product of the movement model. It gives the predicted pod locations given the movement model and the historical data. The nowcast step is the final product of an observation update step that uses the near-real time data (sightings and acoustic detection) to provide the final estimates of pod locations. These "online" estimates of pod locations would be shared with ship pilots, especially if pod locations overlap with shipping lanes. The forecasting process is summarized in the picture below.
What are the expected results?
We hope we will be able to provide daily maps of pod location probabilities in order to limit the overlap between SRKW and marine traffic. We will share our findings as soon as possible!
People involved in the project
The project started in April 2019 and will end in March 2022. The project is funded by DFO and is managed by Dr. Ruth Joy from Simon Fraser University and Prof. Mike Dowd from Dalhousie University.
We warmly thank all our partners for their help to collect and share the data: SIMRES, SMRU Consulting, Jasco Applied Sciences, Vancouver Aquarium and the Ocean Wise, and The Whale Museum.
We are grateful to Joe Watson for prodiving the whale density maps. We also thank SFU MSc students, Emma Cummimgs and Alex Harris, for their great work on the database and acoustic data.
Photo credit: Andrew Trites