Mechanics Experiment 1
THE SIMPLE pendulum
References::
Purpose:
An
"Open Lab" where you will be able to plan and do your own experiment,
make your own mistakes, criticise the mistakes of others, and maybe learn from
them.
Apparatus: String,
weights, ring stand, meter stick, stop watch, electronic timer, anything else
we have.
|
|
Method: You fill in this section
EXPERIMENT: PENDULUMS
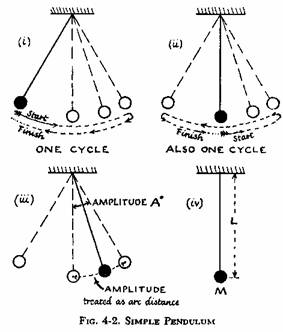
Narrow your field of investigation down to a simple pendulum, a small bob swinging to and fro on a long thread; and narrow it still more to the question, "How does the time-of-swing or period of a pendulum depend on each of the physical factors that might affect it?" Thus restricted, this is still a complex investigation unless you follow the good scientific practice of holding all the other factors constant while you change one chosen factor at a time. See Fig. 4-2.
We define the PERIOD as the time of one
"swing-swang," one complete cycle. What factors might affect the period?
Obviously the LENGTH of the pendulum--most easily defined as distance from
support to center of bob, but not easily, or wisely, measured directly in that
form. We all know a longer pendulum
takes more time to swing to-and-fro.
But just how is period T
related to length L? Is there a
simple mathematical rule? (There is.
We can deduce it from other experimental knowledge, e.g., from force
vectors and
What other factors might affect T? Mass or weight of bob; amplitude, or size of swing; and possibly other factors?
Start by investigating how T depends on
length of pendulum, L
amplitude of swing, A° each side of vertical
mass of bob, M
To avoid confusing several effects, keep two of the three, L, A, M, constant while you change the third, and measure T. Does it matter which of the three you choose to vary first? In this case it does: there is one logically correct choice. While you are considering this, make some preliminary measurements to try out techniques.
(0).
Preliminary Measurements
A good scientist does not expect a stream of accurate measurements to flow at once from his apparatus. He experiments on his experiment, trying out techniques, gaining skill by practice. Choose a long pendulum, 2 or 3 ft long, and make accurate timings of its period with a good stop-watch (or use a magnifying glass over the seconds hand of an ordinary watch while a partner gives you signals.) Record your measurements. Compare them with your partner's. Look at the methods being used by neighbors, and get ready to criticize.
Discussion Group
When you have practical experience of your apparatus, meet with other students and the instructor, as a "research council" to discuss difficulties and techniques. This is the time to suggest good tricks you have discovered, to criticize mistakes you saw neighbors making, to discuss the reliability of the equipment, and to decide on good techniques and plan the order of experiments. There is little use in such a discussion before you have done preliminary experimenting: that would lead to childish guessing or else your instructor would have to step in with cookbook directions. As in a professional research group, an adult discussion needs practical experience of the apparatus.
At this time you will find there is a good reason for investigating the effect of AMPLITUDE first, before MASS or LENGTH.
(1).
Measurements: T vs. A
Make careful measurements of T for various amplitudes such as 60°, 40°, 30°, 20°, 10°, 7°, 5° and 3°. Plot a rough graph of T against A as you go, to guide your further measurements. If you find the graph-points use only a narrow region of your paper, you should plot another graph with one coordinate expanded, so that the blown-up graph reveals the shape better. (A blown-up graph need not have the origin on the paper--in fact its origin may be many inches off the paper.) If you run into difficulties, discuss them with your instructor--treat him as a source of good advice from another scientist, not as a short cut to "right answers."
When you have enough good measurements, plot a careful graph of T against A―with a blown-up version, too, if that seems called for.
At this stage, another conference is likely to be useful. Comparing your graph with the graphs of others, you will probably decide there is a definite relationship, but many graphs may show such large accidental errors that their form is obscured. An accurate answer to "How does T depend on A?" is essential: the other parts of this investigation will be impossible without it. You will need very careful measurements of T for a certain range of amplitudes. It will be obvious from your present graphs what that range is, and why measurements outside that range need not be very accurate.
More accurate measurements
With increased skill from practice and better knowledge of techniques, make the measurements needed to settle the essential question about T and A and plot them in the graph of T against A. (This sounds like a long piece of drudgery, fussing over better precision. It will take time and trouble, but the outcome is rewarding.) When you have settled the question write your answer or conclusion clearly, and use it in part (2).
(2).
Measurements: T vs. M
How much faster would you expect a heavy bob to pull the pendulum to and fro than a light one? Measure T for a fairly long pendulum, using the conclusion of your T vs. A experiments to guide your arrangements. (Of course you should not repeat your T vs. A investigation all over again for each bob in this investigation. Once that is settled it is settled, and its results can be used without repeating the investigation.)[1] Change to another bob much heavier or much lighter and repeat your measurements. Make sure that the L , from support to center of bob, is the same for both. (That is why we offered the cookbook suggestion of a long pendulum: the longer the thread the smaller the % change in L if you make a small mistake in changing bobs.)
(3).
Measurements of T vs. L
The period T changes greatly as L changes, and a good graph (or other investigation) of the relationship between them needs many data points. Make at least 10 careful measurements of T for various L values ranging from 0.2m to 1.0m. Plot a graph of T against L.
"The Pendulum Formula." Measuring g
There is a definite relationship between T and L, a well-known one that you are likely to meet in physics books or as an example in algebra books. If you do not already know it, try guessing at it from the numbers in the communal record, or from the shape of your graph. Then plot a second graph of something else (1/T?, ÷T ?, ... ?) against L that you expect to give a straight line. Or, if you prefer, ask an instructor to tell you the relationship--as a piece of well-known hearsay--and use it to plot a straight-line graph. Draw the "best straight line" that runs "as near as possible to as many points as possible."
The pendulum formula relating T and L also contains "g," and pendulum timings offer the most precise methods of measuring g today. If you do not know it, get the full formula from your instructor and calculate "g" from your straight-line graph. For that you need first the slope of that line--by using the slope instead of single measurement, you are taking a weighted average of many measurements.
Advanced Topic: T vs. A
For small amplitudes A, the period T changes little, but what about larger angles? Experimentally, you should see some
dependence that cannot be accounted for by random errors. Can we analyze this further? We have an unknown function T(A), whose value we know only at A=0. From
T(A) = T0 + a A + b A2 + g A3 + d A4 + ... , (1)
where a, b, g, d, ... are numerical coefficients whose values are related to derivatives of T(A) evaluated at A=0. Because we don't know the function T(A), we don't know their values. However, by clever "physical" reasoning, we can nonetheless say something more about them. First off, T0 is just the period found using the small-angle approximation. What about the next term? Physically, we expect
T(A) = T(-A) . (2)
Starting the pendulum off on one side or the other should not change its period. This is something that we always expect, regardless of how large A is. We say that the problem has a symmetry (left and right directions can be interchanged, and everything looks the same). If we substitute the "symmetry relation" T(A) = T(-A) into Eq. 1, we find that Eq. 2 can only be satisfied if the coefficients of the odd powers in A (a,,g, ...) are all identically zero. Thus, we know that
T(A) = T0 + bA2 + .... (3)
We can even say more about T(A). Recall (and make sure you understand!) that the exact equation of motion for a simple pendulum is
d2q/dt2 + w02 sin q = 0 , with w02 = g/l . (4)
In writing down Eq. 4, we have implicitly specified units for time (and also w0, whose units are 1/t). They usually would be in seconds, say. But we are free to choose other units. For example, we could choose units where one unit of time is just 1/w0. We do this by changing variables to t = w0*t. If we substitute this change of variable into Eq. 4 and use the chain rule twice, we find (and you should verify!) that
d2q/dt 2 + sin q = 0, with q = q(t) (5)
For this new equation, l
and g have "disappeared"
(or been "scaled away," as one says). Of course, they are still there, hidden
in the units of time. For Eq. 5,
the small-angle approximation is T'0
= 1 (that's how the units were chosen), and the
T(A) = T0 (1 + b' A2) . (6)
In Eq. 6, b' is just a number, and, in particular,
does not depend on g or l.
Physically, we can say two more things about b': First, if we go back to the equation of
motion for the pendulum (Eq. 4), we can expand the sine term in a
l d2q/dt2 + g (q -q3/6 + ...) = l d2q/dt2 + [g (1 -q2/6 + ...)] q = 0, (7)
The second part of Eq. 7 suggests (loosely) that we can
think of the motion as that of an oscillator with a "soft" spring,
whose spring constant is k = g(1- q2/6
+ ...). In other words, the
larger the amplitude, the smaller the spring constant. If the spring constant decreases, then
the period T is longer. The negative sign of the cubic term in
the
Second, because the correction to the sine function is a small number (1/6), we expect b' to also be a small number. (On the other hand, there is no reason to expect it to be exactly the same number.) In other words, we expect 0 < b' << 1. Indeed, a fancy calculation -- which you are not required to do, or even look up -- gives
b' = 1/16 , (8)
Now that's a pretty result! It is so pretty, in fact, that we call it a "universal" result. Take any pendulum -- short or long, light or heavy, on any planet anywhere -- plot T/T0 vs. A2, and you should get a straight line whose slope divided by y-intercept = 1/16!
What can we take away from all this? We started by writing down the most general possible expression for T(A), a power series in A. By applying two powerful principles, symmetry and dimensional analysis, we learned much about the possible form for T(A), without doing any "real" work.
・
Symmetry told us that the coefficients in
front of all the odd powers of A had
to vanish in the
・ Dimensional analysis (looking at the units of variables and parameters) told us that T(A) could be written in the form T(A) = T0 * f(A), where T0 was the small-angle period and f(A)=1 + b' A2 +... was a function of A that did not depend on any of the pendulum's physical parameters (i.e., l or g or m).
These two principles are important in many other problems and are both ways of understanding a physical system more deeply than one might at first think possible.
Prelab question
Can we consider the motion of a simple pendulum as simple harmonic motion? Why or why not?