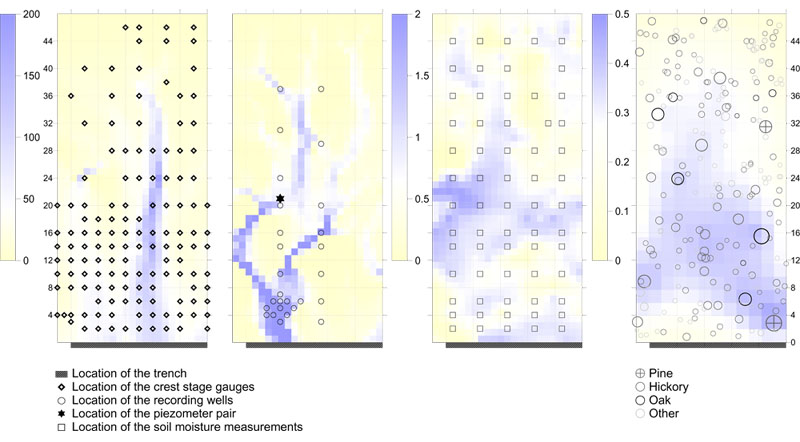
Figure 4. Instrument layout and tree distribution on the PMRW hillslope.
From left to right, location of crest stage gauges (diamonds) and map of surface topography contributing area (m2);
location of recording wells (circles) and map of bedrock topography contributing area (m2);
location of soil measurements (squares) and map of soil depth (m);
tree distribution and map of the weighted basal area (![]() , where Batree is the basal area of a tree, L is the distance between the tree and the location for which the weighted basal area is calculated, and α (=0.2) is a constant determining the decline in weighting of a tree with the distance from the tree (Tromp van Meerveld and McDonnell, 2006c)).
, where Batree is the basal area of a tree, L is the distance between the tree and the location for which the weighted basal area is calculated, and α (=0.2) is a constant determining the decline in weighting of a tree with the distance from the tree (Tromp van Meerveld and McDonnell, 2006c)).