
|
|
|
|
Comparison between the three models yielded interesting results. Table 6 shows the comparison of RMSE between the three models. The IDW and Cokriging models had similar performances, but IDW performing slightly better. Both models performed better than the Linear Regression model. This result comes as somewhat of a surprise because the Cokriging model was expected to perform better than the other two. The Discussion will further discuss these findings. Figures 14, 15, 16, 17, and 18 show the final interpolated layers for all three models. For ease of comparison, all layers were displayed by the same colour scheme and precipitation isohyets. It is important to emphasize the assumption made here regarding cross-validation and the RMSE produced. Without additional data points to validate the model, the model is assumed to be making predictions across the entire layer in a consistent fashion. It is also assumed that the cross validation procedures and the RMSE reflect an overall predictive layer across the entire study area, not just the data points in the dataset.
In the context of the discussion above, the IDW model has been deemed to be
the best model produced for the project for a number of reasons. Firstly, it
performs better than the other two models. Secondly, the times where Cokriging
performs better, it does so only marginally over the IDW model. The set of layers
from January to December and annual interpolation of IDW model is presented
in Appendix I.
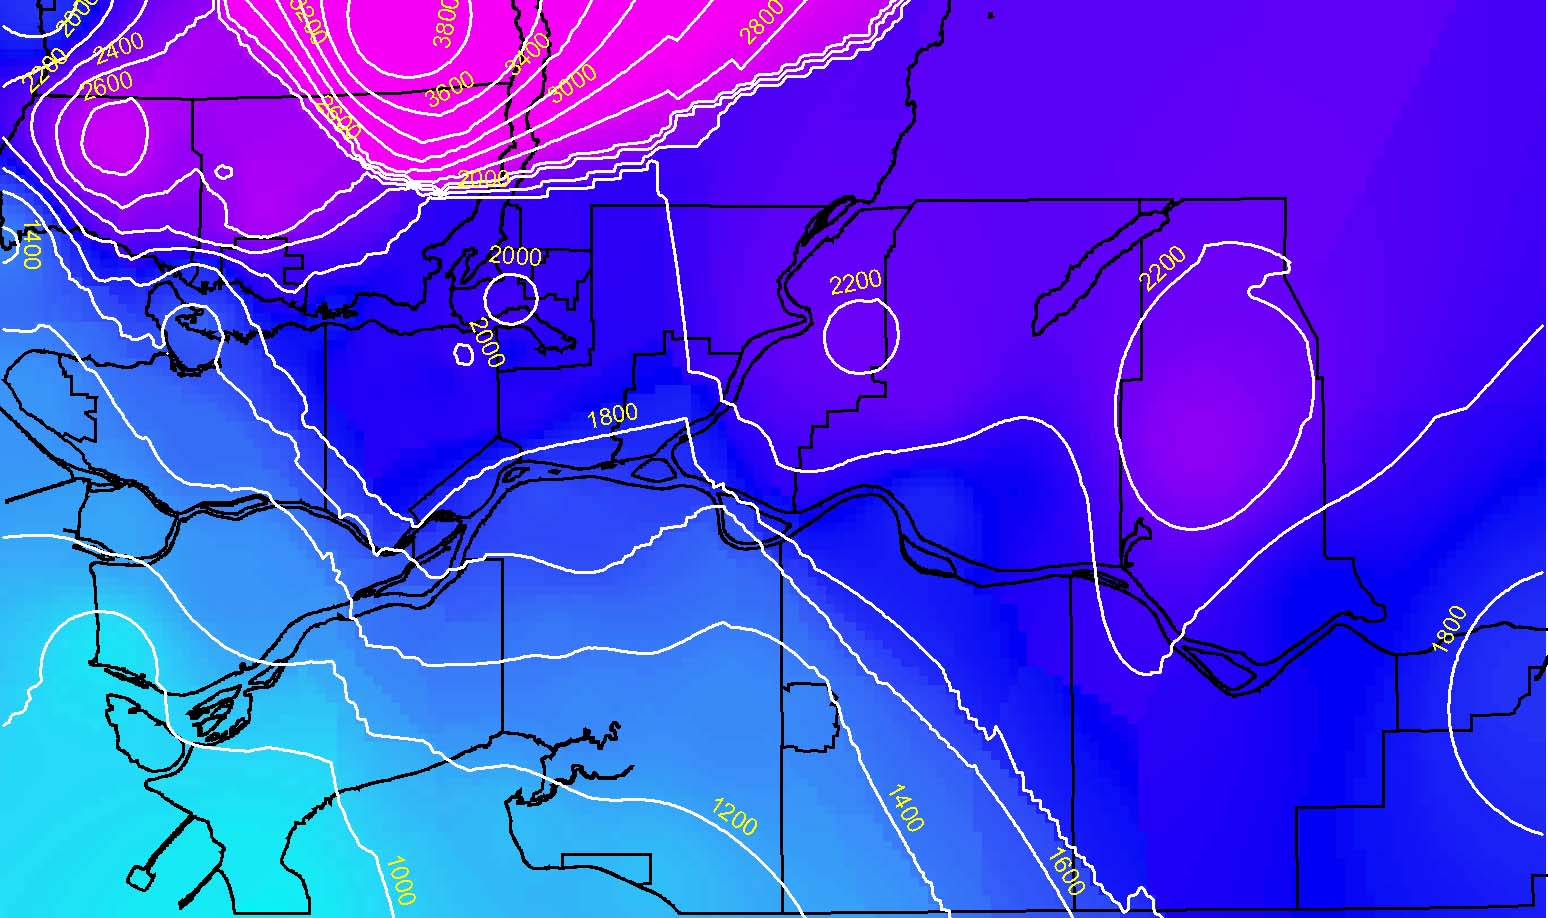 |
| Annual
image of precipitation using the IDW method(with 20 m isohyet intervals).
Click on the image above to view a flash presentation of the precipitation
atlas.
|
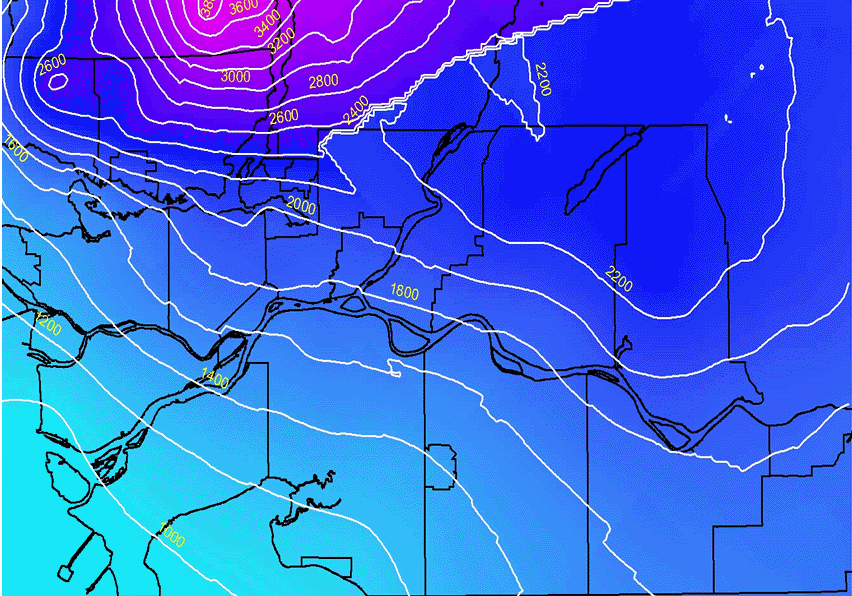 |
| Annual
image of precipitation using the Cokriging method (with 20 m isohyet intervals) |
| back to
top |