(4)
Spatial Analysis
|
In
this section, I will show you how I use Weighted Linear Combination (WLC)
and Multi-Objective Land Allocation (MOLA) modules in the Decision Support
within IDRISI to find solutions for the land allocation problem in the
GVRD.
|
What you can find out in this section:
First
of all, here are the 2 pairwise
comparison matrices that I created
for my 2 policy scenarios:
SCENARIO
1: Maximum Environmental Protection Model
-
Rating of Row Factor Relative to the Column
Factor
|
|
Slopes
|
Distance from Watershed
|
Distance from Park
|
Major Roads Proximity
|
Distance to Developed
Land
|
Land Use
|
|
Slopes
|
1
|
|
|
|
|
|
|
Distance from Watershed
|
1/5
|
1
|
|
|
|
|
|
Distance from Park
|
1/3
|
1
|
1
|
|
|
|
|
Major Roads Proximity
|
1/9
|
1/5
|
1/7
|
1
|
|
|
|
Distance to Developed Land
|
1/7
|
1/3
|
1/7
|
5
|
1
|
|
|
Land Use
|
1/5
|
1/3
|
1/3
|
3
|
3
|
1
|
Consistency Ratio = 0.08
-
The Corresponding Factor Weights that are Derived
from the WEIGHT Module
|
Factor
|
Factor Weight
|
|
Slopes
|
0.4575
|
|
Distance from Watershed
|
0.1589
|
|
Distance from Park
|
0.2123
|
|
Major Roads Proximity
|
0.0279
|
|
Distance to Developed Land
|
0.0576
|
|
Land Use
|
0.0858
|
Top of
Page
SCENARIO
2: Compact Cities Model
-
Rating of Row Factor Relative to Column Factor
|
|
Slopes
|
All Roads Proximity
|
Skytran Proximity
|
Powerline Proximity
|
Distance to Developed Land
|
Land Use
|
|
Slopes
|
1
|
|
|
|
|
|
|
All Roads Proximity
|
5
|
1
|
|
|
|
|
|
Skytrain Proximity
|
5
|
3
|
1
|
|
|
|
|
Powerline Proximity
|
3
|
1/3
|
1/5
|
1
|
|
|
|
Distance to Developed Land
|
7
|
3
|
3
|
5
|
1
|
|
|
Land Use
|
7
|
5
|
1
|
3
|
1/3
|
1
|
Consistency Ratio = 0.08
-
The Corresponding Factor Weights
that are Derived from the WEIGHT Module
|
Factor
|
Factor Weight
|
|
Slopes
|
0.0305
|
|
All Roads Proximity
|
0.1033
|
|
Skytrain Proximity
|
0.2015
|
|
Powerline Proximity
|
0.0580
|
|
Distance to Developed Land
|
0.3819
|
|
Land Use
|
0.2249
|
Top of
Page
MCE:
Single-Objective Suitability Maps from WLC
After the factor weights are generated and the consistency ratio is within
the acceptable range (i.e. less than 0.10), I can input these factor weights
together with the constraints into the Weighted Linear Combination (WLC)
to undertake the Multi-Criteria Evaluation (MCE).
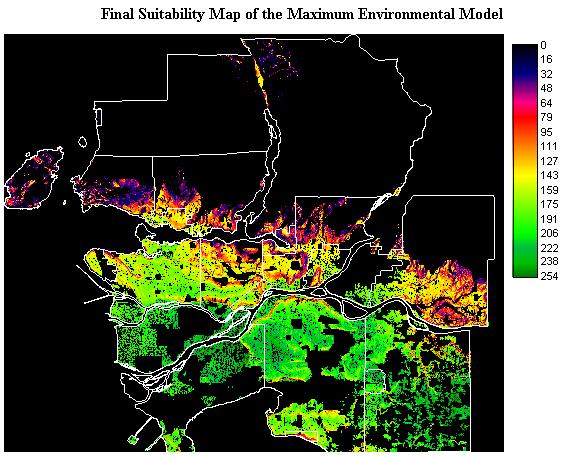
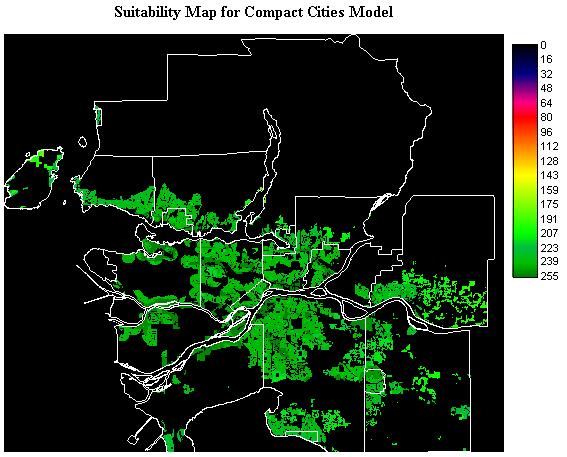
The results of WLC are 2 suitability maps -- one for each scenario. These
maps indicate the relative suitability (0 = least suitable & 255 =
most suitable) of the areas in GVRD for future developments. Notice that
a lot of the areas are masked out (i.e. have a value of 0)
because of the constraints that are applied.
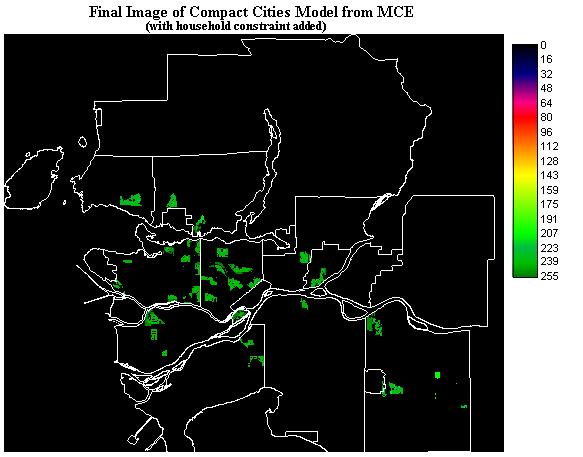
For the "Compact Cities" scenario,
I did one suitability map without the population constraint
(total 3 constraints) and one with the population constraint
(total 4 constraints) so that I can notice the impacts of adding in the
population constraint in the analysis.
-
Suitability Map for Scenario 1
-
Suitability Map for Scenario 2 -- without the
population constraint
-
Suitability Map for Scenario 2 -- with the additional
population constraint
 See the cartographic models for suitability maps of Scenario
1 and Scenario 2.
Top of
Page
See the cartographic models for suitability maps of Scenario
1 and Scenario 2.
Top of
Page
Post-Aggregation
Constraints
There are two basic methods for site
selection using a continuous image of suitability: Specifying a suitability
threshold and total area threshold. Applying either type of thresholds
will result in a Boolean map indicating the selected sites.
-
Suitability Threshold for Scenario 1
-
Goal: To identify areas
with a suitability score of 200 or higher.
-
I run RECLASS with the
suitability map for scenario 1 as the input image -- areas with a suitability
score of 200 or above get a new value of 1 and all other areas get a new
value of 0.
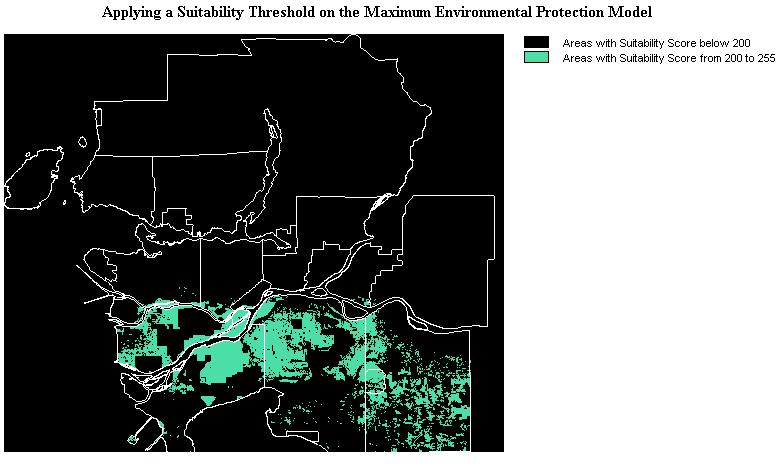
-
I try to use GROUP
with the reclassed image but there are just too many groups being created
(even with diagonals) that it would not display the results; however, this
outcome with GROUP implies that the solutions (or land allocations) are
not spatially contiguous.
-
Total Area Threshold for Scenario 2
-
Goal: To identify the
best 3000 hectares for development under the Compact Cities model.
-
STEP 1: All pixels
are ranked by their degree of suitability.
I run RANK with the
suitability map for scenario 2 as the input image to uniquely rank all
locations in terms of suitability from high to low (descending order).
-
The metadata indicates
that the resolution of the GVRD base map is 50m. Each pixel has an area
of 2500 m2; therefore,
a hectare (10000 m2)
is equal to 4 pixels.
-
In order to have
an area of 3000 hectares, the number of pixels required = 3000 * 4 = 12000.
-
STEP 2: Pixels
are selected based on their suitability.
I run RECLASS with
the ranked image such that those cells ranging from 1 to just less than
12001 have a value of 1 and those cells ranging from 12001 to 9999999 have
a value of 0.
-
STEP 3: Creating
an image that shows the selected areas in terms of suitability scores.
Finally, I OVERLAY
multiply the reclassed image with the final suitability map of scenario
2 to obtain the following image:
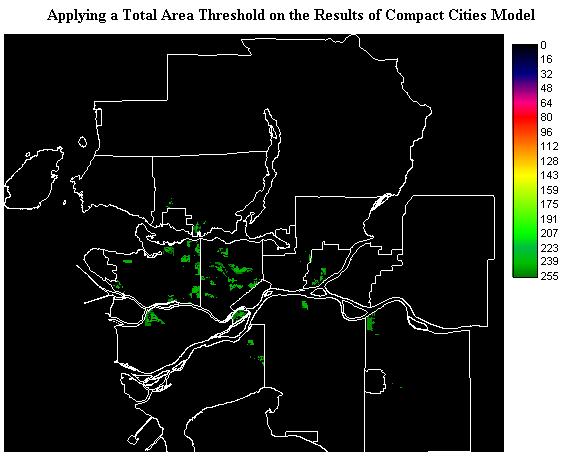
-
As this map shows, the areas that satisfy the
total area threshold tend to have a high level of suitability as well.
Click
here to see the cartographic models of the post-aggregation
maps.
Top of
Page
MCE:
Solving the Multi-Objective Land Allocation Problem
|
Can the Maximium Environmental
model coexist with the Compact Cities model to result in mutually
benefitial land allocations? Read on to see the capability of MOLA to resolve
this multi-objective problem!
|
I apply the MOLA module to find out the best
1500 hectares for development under the Maximum Environmental Protection
scenario and
the best 3000 hectaresfor development
under the Compact Cities scenario.
Is there any conflict
between the areas selected
under the 2 scenarios? In other words, would one pixel be the best allocation
for both of the scenarios at the same time?
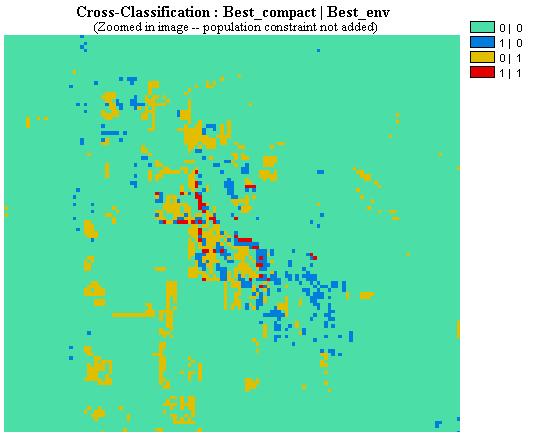
I apply CROSSTAB to the 2 ranked images and
obtain the following result:
It may be quite hard to see
the red-coloured pixels in the previous image (located in Surrey). Here
I zoomed into the areas of conflict to get a better view:
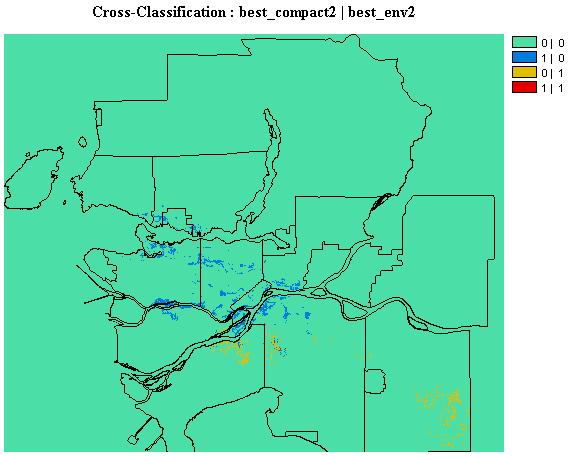
I have repeated the cross-classification
again, but this time I CROSSTAB the ranked images using the suitability
map of scenario 2 with
the population constraint added.
Interestingly, there will
be NO CONFLICT at all!
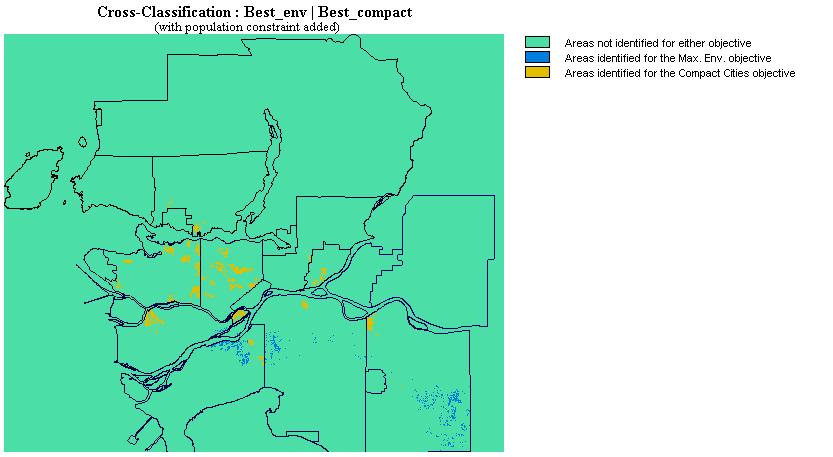
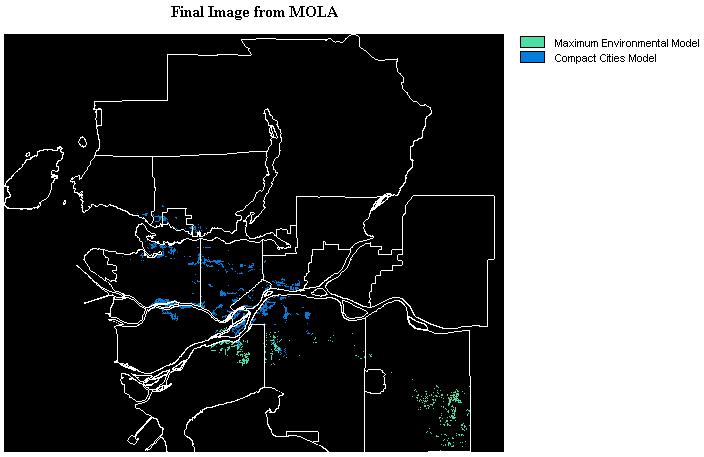
Next, I run the MOLA module
to find out a compromise
solution that is best for the
overall situation -- I specify an equal weight of 0.5 for the 2 objectives,
an area requirement of 6000 pixels for the 1st objective (1500
hectares) and 12000 pixels for the 2nd objective (3000 hectares),
and a 100 pixel tolerance.
-
This final image uses the final
suitability map of scenario 2 (Compact Cities scenario) without the population
constraint. MOLA completes the query in one pass, achieving 5957 and 11993
pixels for each objective respectively.
This is also an image from
MOLA but this one uses the final suitability map of scenario 2 with the
population constraint added. Since there is no conflict between the ranked
images, the final MOLA map is just like the image "Conflict" that is displayed
before.
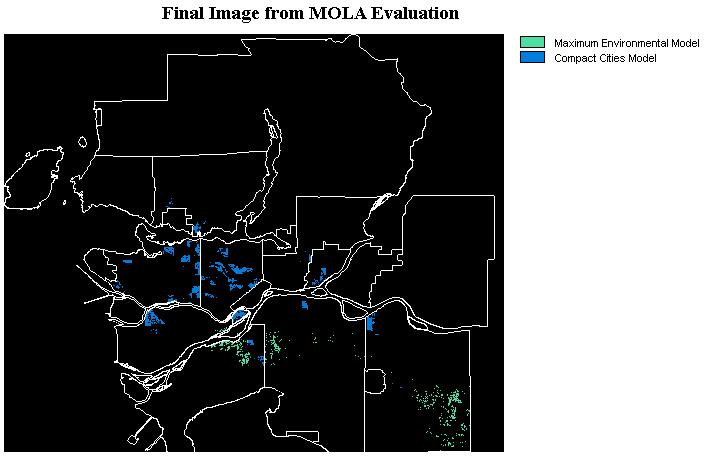
 FINAL
RESULTS:
FINAL
RESULTS:
Both MOLA maps identify the
solutions for both of the objectives:
(1) The best 1500 hectares for "Maximum
Environmental Protection" development
(2) The best 3000 hectares for "Compact
Cities" development
Click
here to see the cartographic
models for the MOLA map presented above.
Top
of Page
 Policy
Implications. . . . . .
Policy
Implications. . . . . .
The images presented above
show the spatial patterns of land allocations under each scenario. However,
it may be a little difficult to find out the answers to the following questions
visually,
| (1) Where
are the best 3000 hectares of land for "Maximum Environmental Protection"
development? |
| (2) Where
are the best 1500 hectares of land for "Compact Cities" development? |
| (3) Which municipality
gains/loses most of their land allocations if the population constraint
is applied? |
| (4) Which municipality
gets most of the land allocations in the MOLA image? |
 Please
visit the next section to find out answers to these questions...
Top of
Page
Please
visit the next section to find out answers to these questions...
Top of
Page