Chapter Contents
Previous
Next
|
Chapter Contents |
Previous |
Next |
| Survival Analysis |
Survival data often consists of a response variable that measures the duration of time until a specified event occurs and a set of independent variables thought to be associated with the event-time variable. Component lifetimes in industrial reliability, durations of jobs, and survival times in a clinical trial are examples of event times. The purpose of survival analysis is to model the underlying distribution of event times and to assess the dependence of the event time on other explanatory variables. In many situations, the event time is not observed due to withdrawal or termination of the study; this phenomenon is known as censoring. Survival analysis methods correctly use both the censored and uncensored observations.

|
Usually, a first step in the analysis of survival data is the estimation of the distribution of the survival times. The survival distribution function (SDF), also known as the survivor function, is used to describe the lifetimes of the population of interest. The SDF evaluated at time t is the probability that an experimental unit from the population will have a lifetime exceeding t. The product limit and actuarial methods are popular techniques for estimating survival distributions.
Proportional hazards regression is a useful technique for assessing the relationship between survival times and a set of explanatory variables. The proportional hazards model of Cox (1972) assumes a parametric form for the effects of explanatory variables on survival times and allows an unspecified form for the underlying survivor function. The proportional hazards model is also known as Cox regression.
The Proportional Hazards task performs Cox regression. You can choose from five different model selection techniques, select from four different methods for handling tied event times, and produce a survivor function plot with confidence intervals.
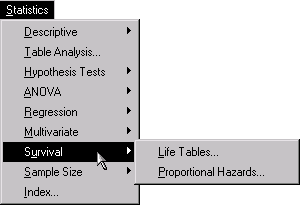
The examples in this chapter demonstrate how you can use the Survival tasks in the Analyst Application to analyze survival data.
|
Chapter Contents |
Previous |
Next |
Top |
Copyright © 1999 by SAS Institute Inc., Cary, NC, USA. All rights reserved.