Chapter Contents
Previous
Next
|
Chapter Contents |
Previous |
Next |
| Customizing Your Session |
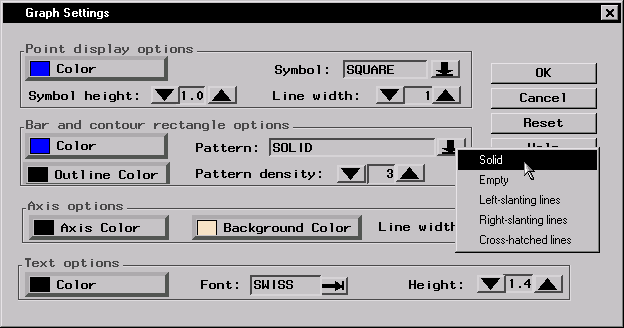
Bar and contour rectangle options control the display of any bars or rectangles in graphs. You can control the outline color, the fill color, the fill pattern, and the pattern density. Click on the Color button to select the color used to fill bars and rectangles.
Click on the Outline Color button to select the color used for bar outlines.
Click on the down arrow next to Pattern: to select a pattern used to fill bars and rectangles.
Click on the down or up arrow next to Pattern density: to change the density of the pattern.
|
|
Chapter Contents |
Previous |
Next |
Top |
Copyright © 1999 by SAS Institute Inc., Cary, NC, USA. All rights reserved.