Chapter Contents
Previous
Next
|
Chapter Contents |
Previous |
Next |
| Creating Graphs |
In the Pie Chart Options dialog, you can control the appearance of your pie chart. Click on the Options button to display the Pie Chart Options dialog. Click OK to save your changes.
|
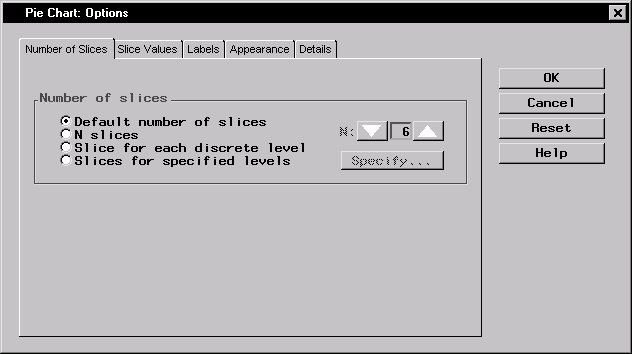
Under Number of slices, select Default number of slices to display an algorithmically determined number of slices. Select N slices and select a number from the list to specify the number of slices to be displayed. Select Slice for each discrete level to display a slice for each discrete level of data. If you are charting no more than one variable, select Slices for specified levels and click on the Specify button to provide a list of midpoints or to specify a range of numeric values, or to provide a list of character values.
|
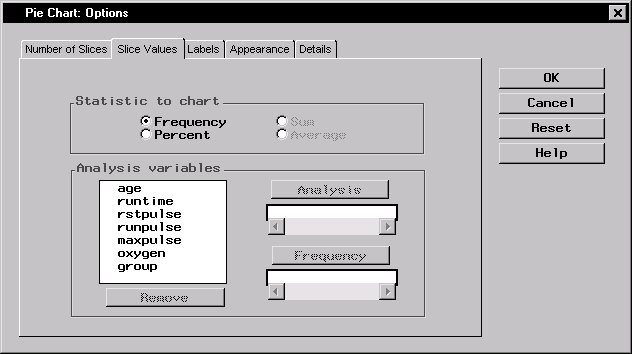
Selecting Frequency under Statistic to chart causes each slice to represent the frequency with which a value or range of values occurs for the chart variable. Selecting Percent causes each slice to represent the percentage of observations of the chart variable having a given value or falling into a given range.
If you want to show some characteristic of an additional variable for each level of the chart variable, select the additional variable as an Analysis variable. Then you can select Sum or Average of the analysis variable as the statistic to compute and display in each slice.
Select a Frequency variable if each observation in the data set represents several real observations, with values of the frequency variable indicating that number.
|
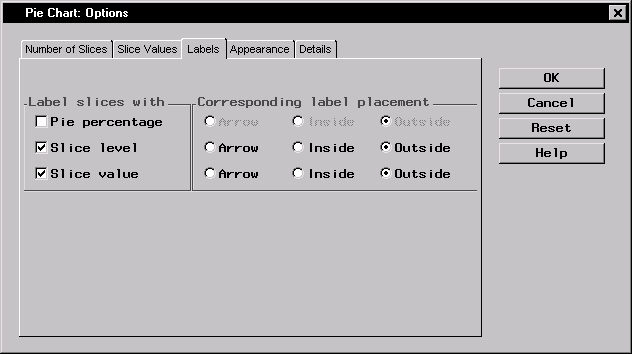
Under Label slices with, you can choose to label the slices with their percentage of the pie chart, the level of the slice, and the value of the slice.
Under Corresponding label placement, you can place each of the labels inside or outside the slice, or you can include an arrow that points from the label to the slice.
|
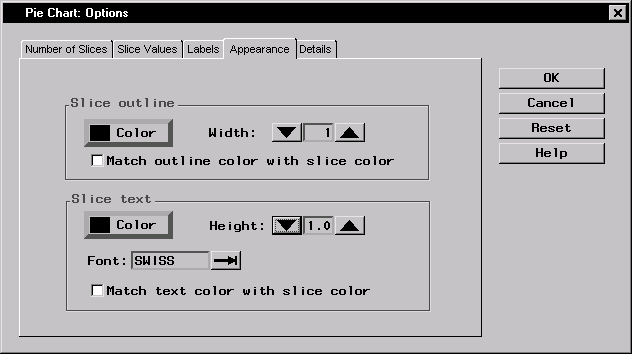
Under Slice outline, select the check box if you want the outline of each slice to be the same as the slice color. You can also control the width of the slice outlines. To select one color to be used for all outlines, click on the Color button and select a color from the Color Attributes dialog.
Under Slice text, select the check box if you want to match the color of the text with the color of the slice. You can also control the height and font of the slice text. To select one color to be used for all text, click on the Color button and select a color from the Color Attributes dialog.
|
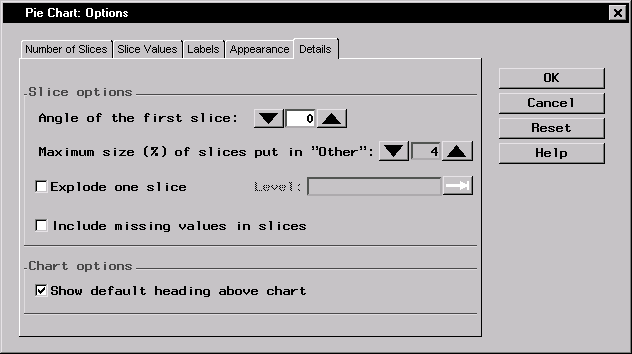
Under Slice options, you can specify the angle in degrees of the first slice by clicking on the up or down arrows or by typing in the degree. You can also define the maximum percentage size of slices you want to gather into an Other category by clicking on the arrows to choose from a range of one to fifteen percent. If you are charting one variable, you can select Explode one slice, and type in the level. If you have selected Slice for each discrete level or Slices for specified levels in the Number of Slices tab, you can click on the arrow next to Level: to select from a range of levels.
You can choose to include missing values in slices.
Under Chart options, you can select Show default heading above chart to include a heading that summarizes what the chart displays.
|
Chapter Contents |
Previous |
Next |
Top |
Copyright © 1999 by SAS Institute Inc., Cary, NC, USA. All rights reserved.