| Robust Regression Examples |
Example 9.7: Stackloss Data
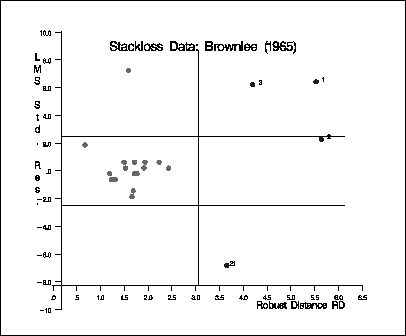
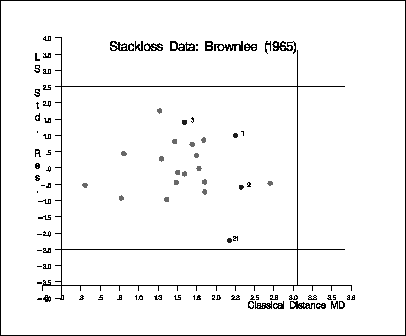
The following two graphs show
- the plot of standardized LMS residuals vs. robust distances RDi
- the plot of standardized LS residuals
vs. Mahalanobis distances MDi
In the first plot, you see that case 4 is a regression
outlier but not a leverage point, so it is a vertical outlier.
Cases 1, 3, and 21 are bad leverage points,
whereas case 2 is a good leverage point.
Note that case 21 lies near the boundary line between vertical
outliers and bad leverage points and that case 2 is very
close to the boundary between good and bad leverage points.
The output follows.
Output 9.7.1: Stackloss Data: LMS Residuals vs. Robust Distances
Output 9.7.2: Stackloss Data: LS Residuals vs. Mahalanobis Distances
Copyright © 1999 by SAS Institute Inc., Cary, NC, USA. All rights reserved.