Chapter Contents
Previous
Next
|
Chapter Contents |
Previous |
Next |
| Contour Plot |
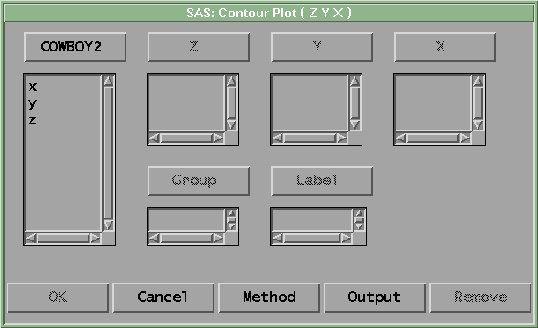
In the dialog, select at least one Z, Y, X variable.
If you select more than three variables, you obtain a matrix of
contour plots.
If the X variable and Y variable are the same, you get a plot
without contours.
You can select one or more Group
variables if you have grouped data.
This creates contour plots for each group.
You can select a Label variable for
labeling observations in the plots.
|
Chapter Contents |
Previous |
Next |
Top |
Copyright © 1999 by SAS Institute Inc., Cary, NC, USA. All rights reserved.