Chapter Contents
Previous
Next
|
Chapter Contents |
Previous |
Next |
| Adjusting Axes and Ticks |
Figure 7.9: Rotating Plot Pop-up Menu
If you are doing exploratory work and are primarily interested in the shape of the point cloud, choose Axes:At Midpoints to display the axes centered in the plot. This display minimizes interference of the axes with your view of the data, in part because tick marks and tick labels are not displayed.
Choose Axes:At Minima to display axes at the minimum data values if you have spatial data and are interested in observation positions. These axes span the range of the data. All tick marks and tick labels are also displayed.
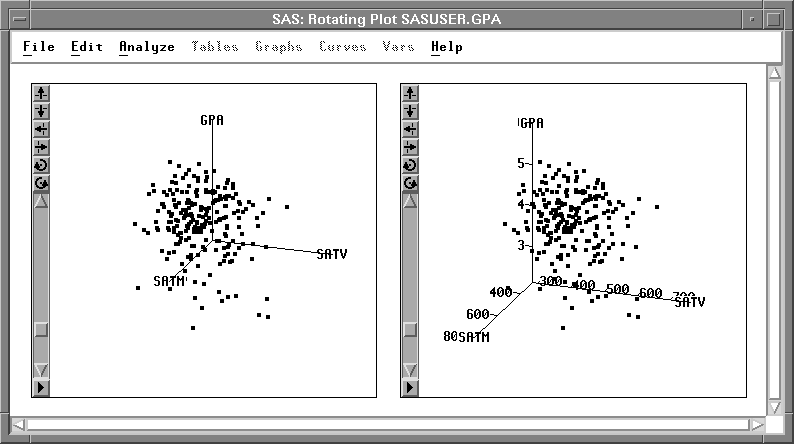
Axes:At Midpoints is the default setting. To change the default, click the Output button in the Rotating Plot Variables dialog and set the Axes:At Minima option. Choose File:Save:Options to save your options.
|
Chapter Contents |
Previous |
Next |
Top |
Copyright © 1999 by SAS Institute Inc., Cary, NC, USA. All rights reserved.
![[menu]](images/axieq2.gif)