|
|
Recommended maximum NOISE LEVELs for given exposure periods, such that OCCUPATIONAL DEAFNESS is minimized. The following table shows the levels adopted in 1971 by the Occupational Safety and Health Act (OSHA) in the U.S.A. for noisy industrial environments. These recommendations have also been accepted by Workers' Compensation Boards in Canada. However, the levels are approximately five decibels above those recommended by the American Otological Association.
See: ACOUSTIC TRAUMA, HEARING LOSS, THRESHOLD OF PAIN, THRESHOLD SHIFT.
The First Draft Amendments, October 1974, of the Workers' Compensation Board of B.C. replaced these criteria (sound level - hours per day) with a standard that would specify graded types of hearing protection (earmuffs, earplugs, fiber batting) to be worn by workers in areas where the sound level exceeds 85 dBA for any period of time.
Exposure to impulsive or impact noise should not exceed 140 dB peak sound pressure level
Duration per Day
(hours)Sound Level
dBA8 90 6 92 4 95 3 97 2 100 1 1/4 102 1 105 1/2 110 1/4 115 Permissible noise levels in dBA established by the Workers' Compensation Boards in North America for industrial noise exposure.
The simple decibel level used does not take into consideration the frequency BANDs in which the sound energy is concentrated (and certain of these, from 1 to 4 kHz, present greater hearing danger), INFRASONIC vibrations, AMPLITUDE MODULATION effects, time variation in sound levels, IMPACT SOUNDs, etc. All of these factors may cause annoyance and create a potential health hazard. See also: EQUIVALENT ENERGY LEVEL.
Recent investigation has shown that average sound levels are not an adequate indicator of hearing risk. Instead, the impulsive character of the sound, in addition to its average intensity level, must be considered. This has been ignored in the past because, first of all, most SOUND LEVEL METERs, even with fast response modes, have an averaging time of about 125 ms, whereas impulse peaks in many sounds occur within 25-50 microseconds. Therefore these meters are unable to measure the true intensity level of such sounds. Moreover, the averaging time of the brain is about 35 ms, and therefore these impulses are actually more intensive than they appear to be based on LOUDNESS. This may be verified by noting that short impulses sound less loud than longer ones of the same intensity. See: CLICK.
The increased risk to hearing arises because, first of all, these impulses are transmitted with full force to the INNER EAR (the averaging times of the outer and middle ears being 50 and 35 microseconds respectively). Moreover, as pointed out by P.V. Brüel, "short impulses with relatively high energy content around 4 kHz are almost always amplified by resonance in the outer and middle ear so that these impulses reach the inner ear with an amplitude 10 - 12 dB higher than other types of noise." This explains the characteristic 'notch' in an AUDIOGRAM that signifies the beginning of noise induced hearing loss (see diagram under AUDIOGRAM). Given this amplification, certain loud sounds may damage the nerve ends of the inner ear producing permanent hearing loss, even though a normal sound level meter would indicate that their level is lower than the danger level.
Brüel concludes that "we must not only determine the sound level with a normal sound level meter, but must furthermore determine the impulsive content of the noise with a sound level meter that can be charged up very quickly." Such a meter has a 'peak hold' circuit with an averaging time of 30 microseconds. When various sounds are measured with such a meter, it is found that certain ones have very high peak levels compared with fast dBA or dBA impulse hold levels, and therefore these pose a greater hearing risk than those without such impulses.
The worst cases are all impact sounds, metalworking machines (punch presses, nailing machines) and bottling machines. More common domestic sounds that fall into this category are lawnmowers, typewriters, electric shavers, interior car noise and clicks in telephone circuitry. Amplified music, on the other hand, does not contain harmful peaks because of dynamic COMPRESSION. Therefore, hearing loss from exposure to loud music, although significant, is not as extensive as the high levels would normally lead one to predict on the basis of levels alone. The damage-risk criteria that have been suggested to take impulsive content into consideration are shown below.
Ref.: P.V. Brüel, "Do We Measure Damaging Noise Correctly?", B&K Technical Review, no. 1, 1976, pp. 3-32.
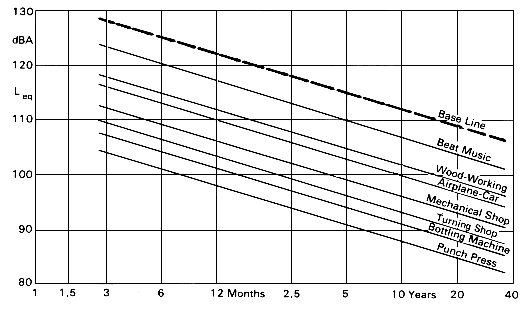
Risk limits of hearing loss (50% probability) for different types of noise, evaluated on the basis of the relation between dBA and Peak value. The lower the line, the higher the risk because of impulsive content (from Brüel, B&K Technical Review, no. 1, 1976, p. 20, used by permission).
|
|
|
|
|
|
|
|
Sinusoidal pure tone 1000 Hz |
|
|
|
|
|
|
Beat music from a gramophone |
|
|
|
|
|
|
Modern music from a gramophone |
|
|
|
|
|
|
Electric guitar from a gramophone |
|
|
|
|
|
|
Motorway traffic, 15m distance |
|
|
|
|
|
|
Motorway traffic, 50m distance |
|
|
|
|
|
|
Train 70 km/h rail noise, 10m distance |
|
|
|
|
|
|
Train 70 km/h rail noise, 18m distance |
|
|
|
|
|
|
Noise in aircraft Type PA 23, cruising speed |
|
|
|
|
|
|
Noise in aircraft Type Falco F 8, cruising speed |
|
|
|
|
|
|
Noise in aircraft Type KZ 3, cruising speed |
|
|
|
|
|
|
Noise in car Type Fiat 500, 60 km/h |
|
|
|
|
|
|
Noise in car Type Volvo 142, 80 km/h |
|
|
|
|
|
|
Lawn mower 10 HK 1m distance |
|
|
|
|
|
|
Typewriter IBM (head position) |
|
|
|
|
|
|
Electric shaver, 2.5m distance |
|
|
|
|
|
|
75 HK diesel motor in electricity generating plant |
|
|
|
|
|
|
Pneumatic nailing machine, 3m distance |
|
|
|
|
|
|
Pneumatic nailing machine near operator's head |
|
|
|
|
|
|
Industrial ventilator 5 HK, 1m |
|
|
|
|
|
|
Air compressor room |
|
|
|
|
|
|
Large machine shop |
|
|
|
|
|
|
Turner shop |
|
|
|
|
|
|
Automatic turner shop |
|
|
|
|
|
|
40 ton punch press, near operator's head |
|
|
|
|
|
|
Small automatic punch press |
|
|
|
|
|
|
Numerically driven high speed drill |
|
|
|
|
|
|
Small high speed drill |
|
|
|
|
|
|
Ventilator with filter |
|
|
|
|
|
|
Machine driven saw, near operator's head |
|
|
|
|
|
|
Vacuum cleaner Type Hoover, 1.2m distance |
|
|
|
|
|
|
Bottles striking each other |
|
|
|
|
|
|
Bottling machine in brewery |
|
|
|
|
|
|
Toy pistol (cap) |
|
|
|
|
|
|
Pistol 9mm, 5m distance from side |
|
|
|
|
|
|
Shotgun, 5m distance from side |
|
|
|
|
|
|
Saloon rifle, 1m distance from side |
|
|
|
|
|
Table showing dBA and peak values measured for various sources. The difference between peak and dBA values, shown in the right-hand column, represents the degree of hearing loss danger caused by the impulsive characteristic of the source. The numerical amount in dB is that by which the damage-risk line must be plotted on the graph below the base line (reference as above).
home