Postscript version of this document
STAT 350: 99-1
Midterm, 17 February 1999Instructor: Richard Lockhart
Instructions: This is an open book test.
You may use notes, text, other books
and a calculator. Your presentations of statistical analysis will be
marked for clarity of explanation. I expect you to explain what
assumptions you are making and to comment if those assumptions seem
unreasonable. The exam is out of 25.
- 1.
- When a spring is stretched by an amount dfrom its original length a standard theory predicts that the amount of
work done will be K d2. In order to estimate K, a spring is
stretched by amounts of 0, 1, 2 and 3 units. For each of these 4 values of
d the corresponding amount of work Y is measured.
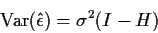
- (a)
- For this experiment write out the design matrix and compute the hat
matrix. [3 marks]
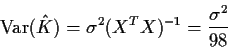
XTX = 02+12 +42+92
- (b)
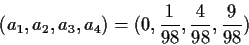
- The least squares estimate of K has the form
a1 Y1+ a2 Y2 + a3 Y3 + a4 Y4. What are
a1,a2,a3,a4?
Your answer should be a set of 4 numbers, not formulas. [2 marks]
so
- (c)
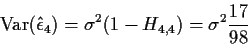
- Make the usual linear model assumptions and assume that the standard
deviation of a typical Y is 0.1 units of work. What is the standard error
of the fourth residual? [2 marks]
so
Hence the standard error asked for is
- (d)
- A statistician who took 350 from me imagines I once said that
you can't fit a quadratic polynomial without including the linear term.
If a linear term in d is included what is the design matrix? [2 marks]
You might also have the columns in the other order.
- (e)
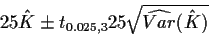
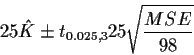
- Give the formula for a 95% confidence interval for the work
done to stretch the spring 5 units. Your formula must be as explicit as
possible; any formula for which you could give me a numerical value
should be worked out to a numerical value, except that you need not
evaluate any square roots in the final answer. Of course, some parts
of the answer depend on the actual values of the Ys which I am not
giving you.[2 marks]
You are asked for a CI for 25K. I tolerated prediction intervals for
a new Y, the measured work, for d=5 as well. The CI
is
Since
we get the interval
I also accepted the use of a normal multiplier and replacement
of the MSE by
 as if you knew
  from the
previous part of the question.
from the
previous part of the question.
- 2.
- For a sample of 250 adult males various body size measurements
are made. As a preliminary analysis of the data the relation between
body Density and a variety of predictors is investigated.
I attach SAS output for the following models;
| Model # |
Predictors |
| 1 |
Abdomen Wrist Age Neck Biceps Thigh Chest |
| |
Forearm Hip Ankle Height Weight Knee |
| 2 |
Abdomen Wrist Age Neck Biceps Chest Hip Height |
| 3 |
Abdomen Wrist Height |
- (a)
- Is the regression of Density on all the predictors significant?
[2 marks]
For Model I the overall F statistic is 51.34 with P=0.0001 so that
any any reasonable level the hypothesis that all the coefficients are 0
is rejected. Thus the regression is indeed significant.
- (b)
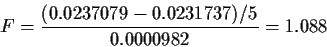
- Is model 2 an adequate fit to the data compared to model 1?
[3 marks]
The extra SS F test is based on
This is looked up in F5,236 tables because there are 5 fewer
parameters in model 2 than in model 1 and 236 degrees of freedom
for error in Model 1 (the full model).
The actual P value is about 0.37 but you may use fixed  critical points to conclude that the hypothesis that all the extra
 s in model 1 are not significantly different from 0; that is,
Model 2 is an adequate fit.
s in model 1 are not significantly different from 0; that is,
Model 2 is an adequate fit.
- (c)
- Can Age be dropped from Model 2?
[2 marks]
The t-statistic for Age in model 2 is -1.34 with a P value of
0.1805. Thus Age is not significant; it can be dropped from
the model.
- (d)
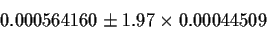
- Give a 95% confidence interval for the coefficient of Height in
Model 1. [2 marks]
The confidence interval is
The estimate and corresponding standard error are printed out by SAS giving
(Too many digits but I didn't worry about that. I also did
not worry too much about what you did about the t multiplier provided
it was reasonable.)
- (e)
- Of the three models for which you have output, which model seems to fit the data best.
[2 marks]
In part b you concluded that model 2 improved on model 1 because it
is simpler, eliminating insignificant terms. On the other hand you cannot
eliminate all the terms you need to eliminate to get from model 2 to model
3
(either do another extra SS F test or just not that some of the deleted
terms are quite significant according to the t tests in model 2).
Thus Model 2 is to be preferred.
- (f)
- For the model you selected in the previous part what is the estimated standard deviation
of the errors?
[1 marks]
0.0099
- (g)
- Suggest two further models you might consider fitting. Give some reason for
trying these models. This requires only a very short answer but I am principally
marking the reason.
[2 marks]
The idea I was looking for was to try models which simplified Model 2 by
eliminating some possibly insignificant terms. This would suggest
eliminating HIP and AGE or perhaps HIP, AGE and NECK. I marked this
one fairly liberally accepting for at least part marks quite a few
explanations.
MODEL 1
Dependent Variable: DENSITY
                                  Sum of         Mean
Source                  DF       Squares       Square  F Value    Pr > F
Model                   13     0.0655339    0.0050411    51.34    0.0001
Error                  236     0.0231737    0.0000982
Corrected Total        249     0.0887076

                  R-Square          C.V.     Root MSE       DENSITY Mean
                  0.738763      0.938523       0.0099             1.0558

Source                  DF     Type I SS  Mean Square  F Value    Pr > F

ABDOMEN                  1     0.0580635    0.0580635   591.31    0.0001
WRIST                    1     0.0039993    0.0039993    40.73    0.0001
AGE                      1     0.0010165    0.0010165    10.35    0.0015
NECK                     1     0.0002624    0.0002624     2.67    0.1034
BICEPS                   1     0.0003259    0.0003259     3.32    0.0698
THIGH                    1     0.0000550    0.0000550     0.56    0.4549
CHEST                    1     0.0003328    0.0003328     3.39    0.0669
FOREARM                  1     0.0001583    0.0001583     1.61    0.2055
HIP                      1     0.0006023    0.0006023     6.13    0.0140
ANKLE                    1     0.0000732    0.0000732     0.75    0.3887
HEIGHT                   1     0.0006151    0.0006151     6.26    0.0130
WEIGHT                   1     0.0000280    0.0000280     0.29    0.5938
KNEE                     1     0.0000015    0.0000015     0.02    0.9008

Source                  DF   Type III SS  Mean Square  F Value    Pr > F

ABDOMEN                  1     0.0101396    0.0101396   103.26    0.0001
WRIST                    1     0.0012065    0.0012065    12.29    0.0005
AGE                      1     0.0003498    0.0003498     3.56    0.0603
NECK                     1     0.0002681    0.0002681     2.73    0.0998
BICEPS                   1     0.0002004    0.0002004     2.04    0.1545
THIGH                    1     0.0001884    0.0001884     1.92    0.1673
CHEST                    1     0.0001730    0.0001730     1.76    0.1857
FOREARM                  1     0.0001729    0.0001729     1.76    0.1858
HIP                      1     0.0001719    0.0001719     1.75    0.1871
ANKLE                    1     0.0001586    0.0001586     1.62    0.2050
HEIGHT                   1     0.0001578    0.0001578     1.61    0.2062
WEIGHT                   1     0.0000259    0.0000259     0.26    0.6081
KNEE                     1     0.0000015    0.0000015     0.02    0.9008


                                 T for H0:     Pr > |T|    Std Error of
Parameter          Estimate     Parameter=0                  Estimate

INTERCEPT       1.092703119           20.08      0.0001      0.05442893
ABDOMEN        -0.002162705          -10.16      0.0001      0.00021283
WRIST           0.004350830            3.51      0.0005      0.00124125
AGE            -0.000141394           -1.89      0.0603      0.00007492
NECK            0.000903669            1.65      0.0998      0.00054689
BICEPS         -0.000566771           -1.43      0.1545      0.00039677
THIGH          -0.000473593           -1.39      0.1673      0.00034192
CHEST           0.000334560            1.33      0.1857      0.00025207
FOREARM        -0.000639418           -1.33      0.1858      0.00048183
HIP             0.000449416            1.32      0.1871      0.00033965
ANKLE          -0.000650693           -1.27      0.2050      0.00051193
HEIGHT          0.000564160            1.27      0.2062      0.00044509
WEIGHT          0.000080268            0.51      0.6081      0.00015633
KNEE            0.000071344            0.12      0.9008      0.00057191
MODEL 2
Dependent Variable: DENSITY
                                  Sum of         Mean
Source                  DF       Squares       Square  F Value    Pr > F
Model                    8     0.0649997    0.0081250    82.59    0.0001
Error                  241     0.0237079    0.0000984
Corrected Total        249     0.0887076

                  R-Square          C.V.     Root MSE       DENSITY Mean
                  0.732741      0.939380       0.0099             1.0558

Source                  DF     Type I SS  Mean Square  F Value    Pr > F
ABDOMEN                  1     0.0580635    0.0580635   590.24    0.0001
WRIST                    1     0.0039993    0.0039993    40.65    0.0001
AGE                      1     0.0010165    0.0010165    10.33    0.0015
NECK                     1     0.0002624    0.0002624     2.67    0.1037
BICEPS                   1     0.0003259    0.0003259     3.31    0.0700
CHEST                    1     0.0003603    0.0003603     3.66    0.0568
HIP                      1     0.0003324    0.0003324     3.38    0.0673
HEIGHT                   1     0.0006394    0.0006394     6.50    0.0114

Source                  DF   Type III SS  Mean Square  F Value    Pr > F
ABDOMEN                  1     0.0116909    0.0116909   118.84    0.0001
WRIST                    1     0.0010761    0.0010761    10.94    0.0011
AGE                      1     0.0001774    0.0001774     1.80    0.1805
NECK                     1     0.0002434    0.0002434     2.47    0.1170
BICEPS                   1     0.0005632    0.0005632     5.72    0.0175
CHEST                    1     0.0003868    0.0003868     3.93    0.0485
HIP                      1     0.0001138    0.0001138     1.16    0.2831
HEIGHT                   1     0.0006394    0.0006394     6.50    0.0114

                                 T for H0:     Pr > |T|    Std Error of
Parameter          Estimate     Parameter=0                  Estimate
INTERCEPT       1.062471175           53.53      0.0001      0.01984842
ABDOMEN        -0.002133222          -10.90      0.0001      0.00019568
WRIST           0.003778287            3.31      0.0011      0.00114235
AGE            -0.000088111           -1.34      0.1805      0.00006561
NECK            0.000806964            1.57      0.1170      0.00051298
BICEPS         -0.000841346           -2.39      0.0175      0.00035163
CHEST           0.000409888            1.98      0.0485      0.00020672
HIP             0.000280433            1.08      0.2831      0.00026068
HEIGHT          0.000748582            2.55      0.0114      0.00029363
MODEL 3
Dependent Variable: DENSITY
                                  Sum of         Mean
Source                  DF       Squares       Square  F Value    Pr > F
Model                    3     0.0635560    0.0211853   207.21    0.0001
Error                  246     0.0251516    0.0001022
Corrected Total        249     0.0887076

                  R-Square          C.V.     Root MSE       DENSITY Mean
                  0.716467      0.957674       0.0101             1.0558

Source                  DF     Type I SS  Mean Square  F Value    Pr > F

ABDOMEN                  1     0.0580635    0.0580635   567.90    0.0001
WRIST                    1     0.0039993    0.0039993    39.12    0.0001
HEIGHT                   1     0.0014933    0.0014933    14.61    0.0002

Source                  DF   Type III SS  Mean Square  F Value    Pr > F

ABDOMEN                  1     0.0515675    0.0515675   504.37    0.0001
WRIST                    1     0.0020169    0.0020169    19.73    0.0001
HEIGHT                   1     0.0014933    0.0014933    14.61    0.0002

                                 T for H0:     Pr > |T|    Std Error of
Parameter          Estimate     Parameter=0                  Estimate

INTERCEPT       1.071106097           58.02      0.0001      0.01845975
ABDOMEN        -0.001770706          -22.46      0.0001      0.00007884
WRIST           0.004186145            4.44      0.0001      0.00094252
HEIGHT          0.001022304            3.82      0.0002      0.00026750
Richard Lockhart
1999-02-17
![\begin{displaymath}X=\left[\begin{array}{c} 0 \\ 1 \\ 4 \\ 9 \end{array}\right]
\end{displaymath}](img1.gif)
![\begin{displaymath}H=X(X^TX)^{-1}X^T = \left[\begin{array}{cccc}
0 & 0 & 0 & 0
\...
...frac{9}{98} & \frac{36}{98} & \frac{81}{98}
\end{array}\right]
\end{displaymath}](img2.gif)
![\begin{displaymath}\hat{K} = (X^TX)^{-1} X^T Y = \frac{1}{98} \left[ \begin{arra...
...t[\begin{array}{c} Y_1 \\ Y_2 \\ Y_3 \\ Y_4 \end{array}\right]
\end{displaymath}](img3.gif)

![\begin{displaymath}X=\left[\begin{array}{cc}
0 & 0
\\
1 & 1
\\ 2 & 4
\\
3 & 9
\end{array}\right]
\end{displaymath}](img8.gif)