![]()
![]()
![]()
Reading for Today's Lecture:
Goals of Today's Lecture:
Suppose you toss a coin 6 times and get Heads twice. If p is the
probability of getting H then the probability of getting 2 heads is
Definition: A model is a family
![]() of possible distributions for some random variable X.
Typically the model is described by specifying
of possible distributions for some random variable X.
Typically the model is described by specifying
![]() the set of possible densities of X.
the set of possible densities of X.
Definition: The likelihood function is the function L whose domain
is ![]() and whose values are given by
and whose values are given by
The key point is to think about how the density depends on ![]() not
about how it depends on X. Notice that X, the observed value of the
data, has been plugged into the formula for the density. Notice also
that the coin tossing example is like this but with f being the discrete
density. We use the likelihood in most of our inference problems:
not
about how it depends on X. Notice that X, the observed value of the
data, has been plugged into the formula for the density. Notice also
that the coin tossing example is like this but with f being the discrete
density. We use the likelihood in most of our inference problems:
Maximum Likelihood Estimation
To find an MLE we maximize L. This is a typical function maximization problem which we approach by setting the gradient of L equal to 0 and then checking to see that the root is a maximum, not a minimum or saddle point.
We begin by examining some likelihood plots in examples:
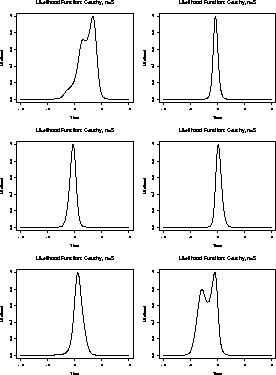
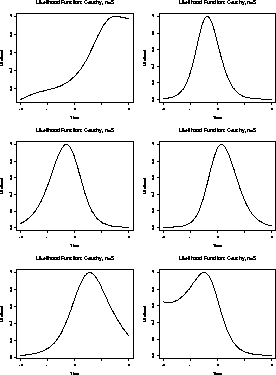
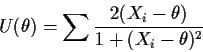
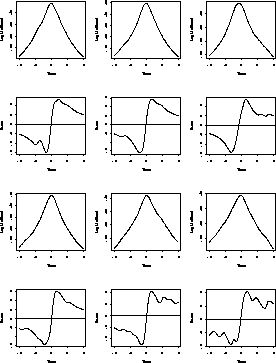
Cauchy Data
We have a sample
![]() from the Cauchy
from the Cauchy![]() density
density
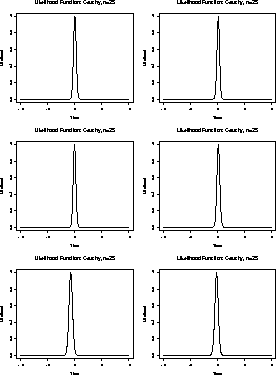
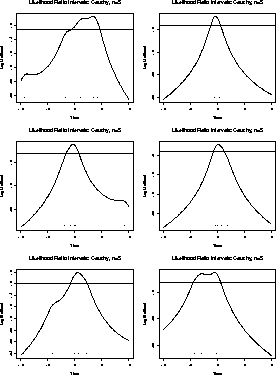
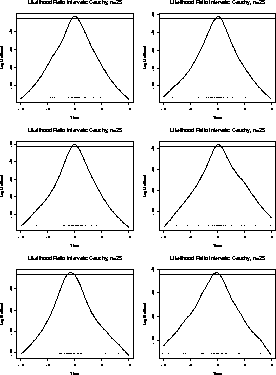
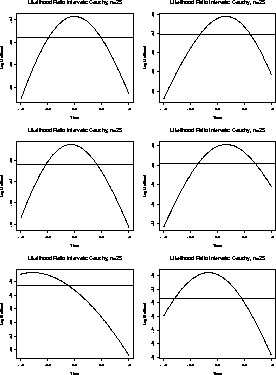
Here are some plots of this function for 6 samples of size 5.
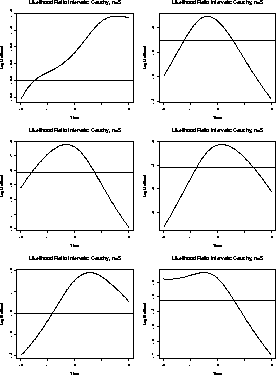
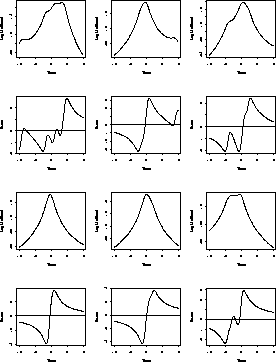
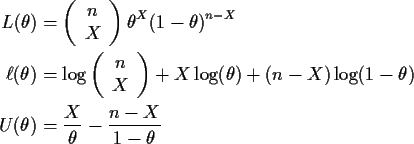
Here are close up views of these plots for ![]() between -2 and 2.
between -2 and 2.
To maximize this likelihood we would have to differentiate L and
set the result equal to 0. Notice that L is a product of n terms
and the derivative will then be
Definition: The Log Likelihood function is
For the Cauchy problem we have
You can see that the likelihood will tend to 0 as
![]() so that the maximum of
so that the maximum of ![]() will occur at a root of
will occur at a root of
![]() ,
the derivative of
,
the derivative of ![]() with respect to
with respect to ![]() .
.
Definition: The Score Function is the gradient of ![]()
The MLE
![]() usually solves the Likelihood Equations
usually solves the Likelihood Equations
In our Cauchy example we find
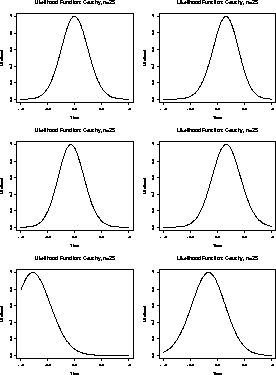
Here are some plots of the score functions for n=5 for our
Cauchy data sets. Each score is plotted beneath a plot of the
corresponding ![]() .
.
If X has a Binomial
![]() distribution then
distribution then
The function L is 0 at ![]() and at
and at ![]() unless X=0or X=n so for
unless X=0or X=n so for
![]() the MLE must be found by setting
U=0 and getting
the MLE must be found by setting
U=0 and getting
The Normal Distribution
Now we have
![]() iid
iid
![]() .
There are
two parameters
.
There are
two parameters
![]() .
We find
.
We find
![\begin{align*}L(\mu,\sigma)& = (2\pi)^{-n/2} \sigma^{-n}
\exp\{-\sum(X_i-\mu)^2/...
...rac{\sum(X_i-\mu)^2}{\sigma^3} -\frac{n}{\sigma}
\end{array}\right]
\end{align*}](img44.gif)
Notice that U is a function with two components because ![]() has
two components.
has
two components.
Setting the likelihood equal to 0 and solving gives
![\begin{displaymath}\left[\begin{array}{cc}
\frac{-n}{\sigma^2} & \frac{-2\sum(X_...
...m(X_i-\mu)^2}{\sigma^4}
+\frac{n}{\sigma^2}
\end{array}\right]
\end{displaymath}](img47.gif)
![\begin{displaymath}H(\hat\theta) = \left[\begin{array}{cc}
\frac{-n}{\hat\sigma^2} & 0
\\
0 & \frac{-2n}{\hat\sigma^2}
\end{array}\right]
\end{displaymath}](img48.gif)
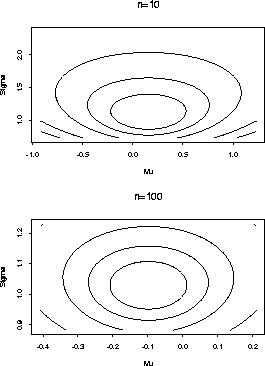
Here is a contour plot of the normal log likelihood for two data sets with n=10 and n=100.
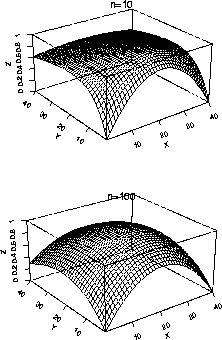
We now turn to theory to explain the features of these plots, at least approximately in large samples.