TIME SCAPE Graphs
This assignment has 2 steps: one week of recording data and in the second week based on your data you will create a 2-dimensional graph. Our graphs will be exhibited at the exhibition at Camera Austria in Graz, Austria. With students from the University of Cologne we will organize a peer review session.
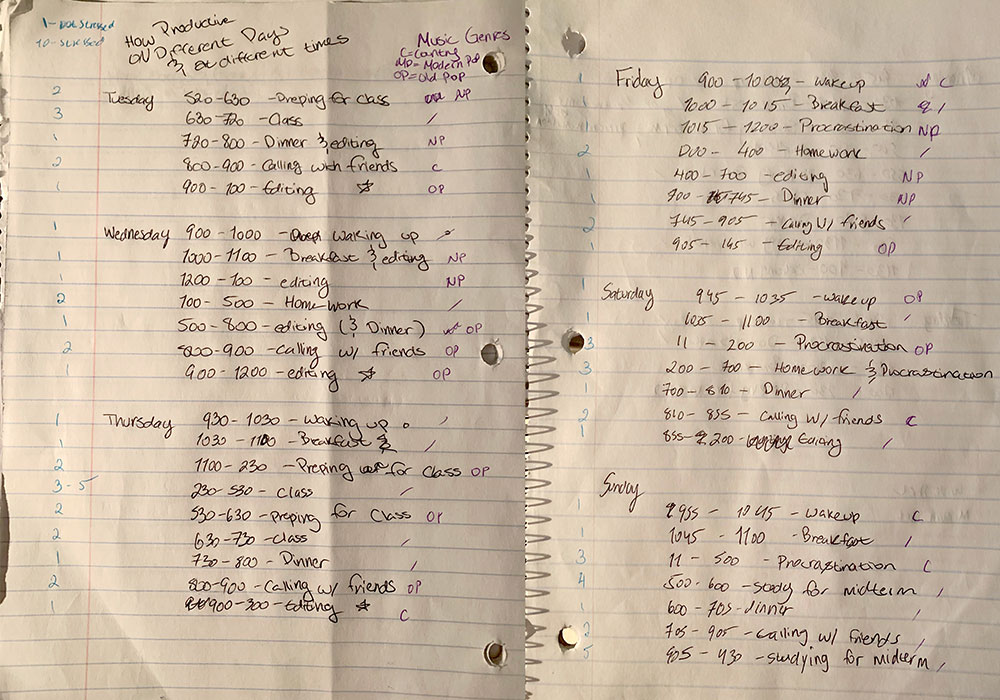
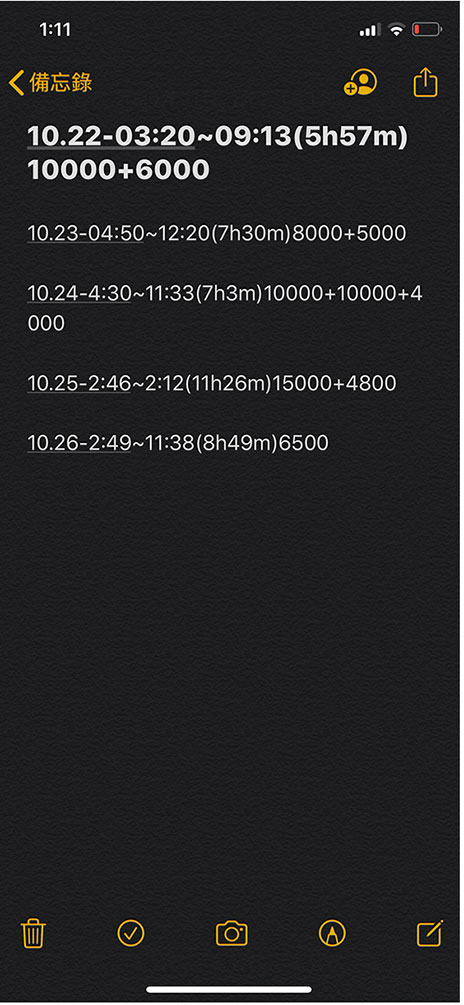
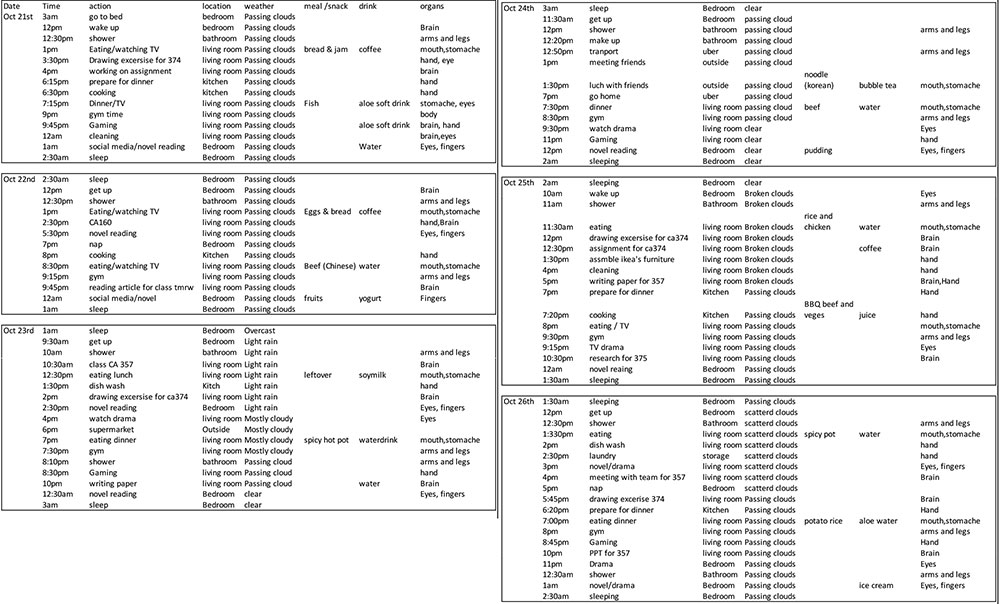
1__ RECORDING
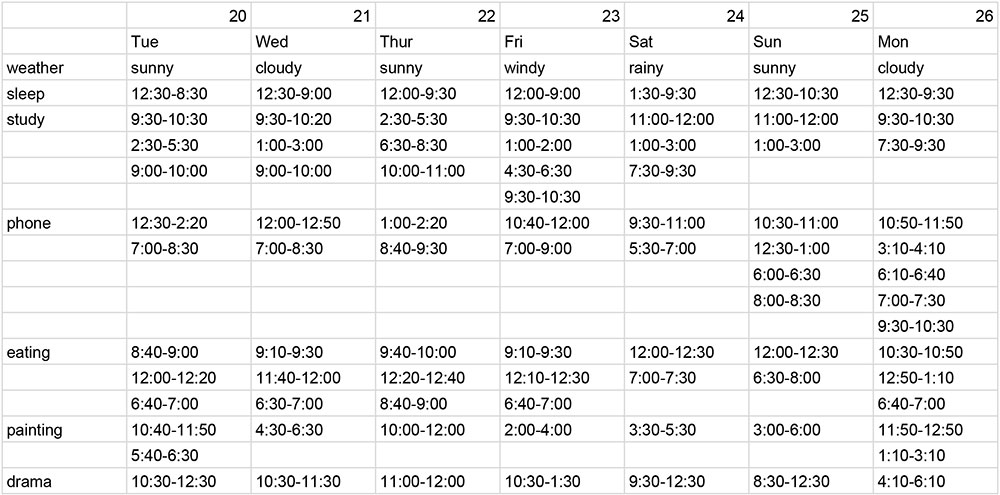
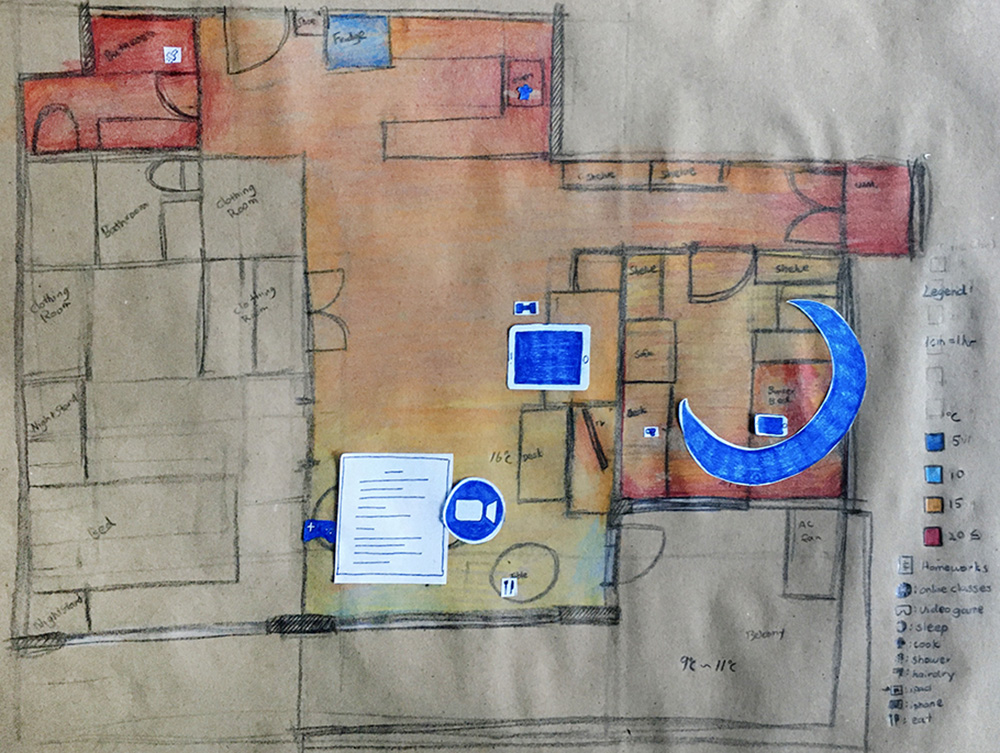
referring to Annette Krauss' project Unlearning Exercises, chapter 7. TIME DAIRY, you will make a record of your week. You make notes how you spend your time. Keep a log of your day/week, indicating when things happen, map this onto a timing sheet, set up for appropriate intervals.
Read about the context of Annette Krauss' Unlearning Exercises: Site for Unlearning
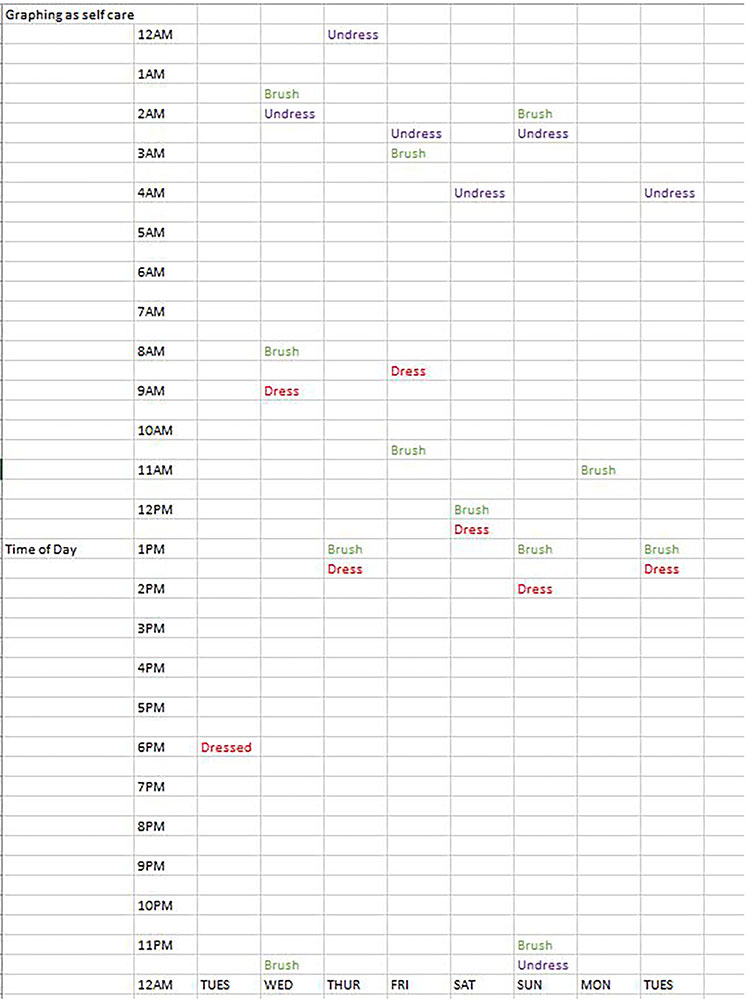
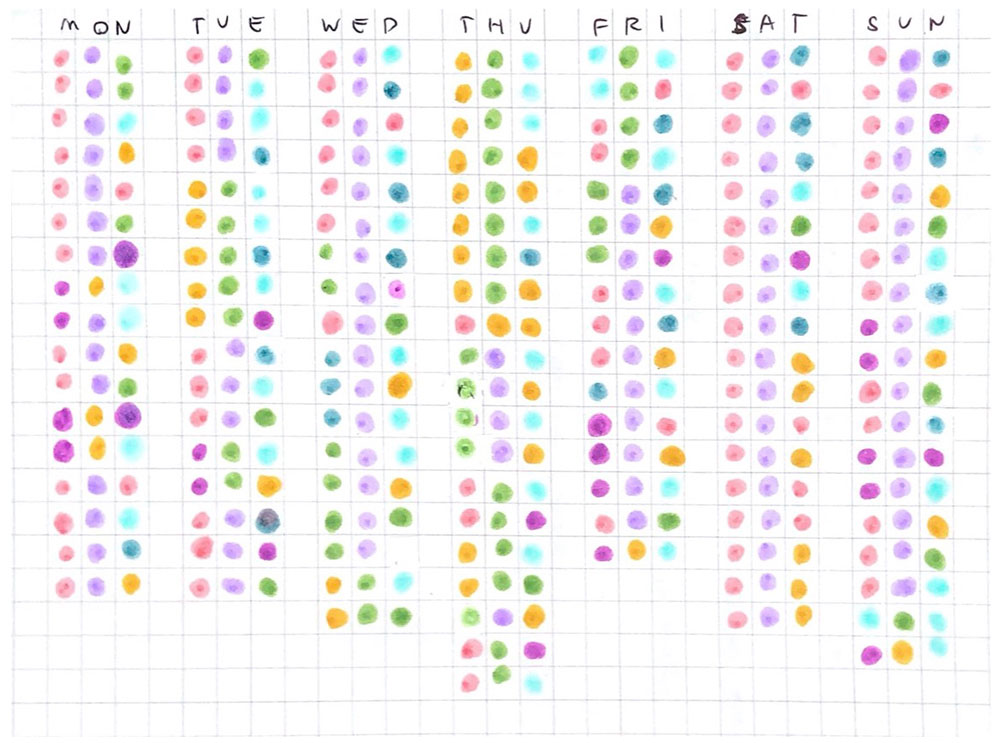
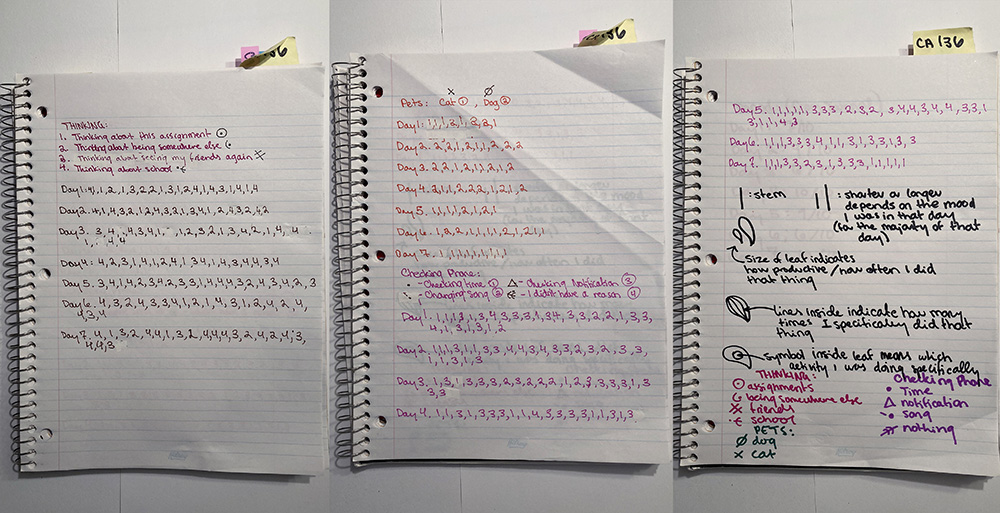
2__ GRAPH
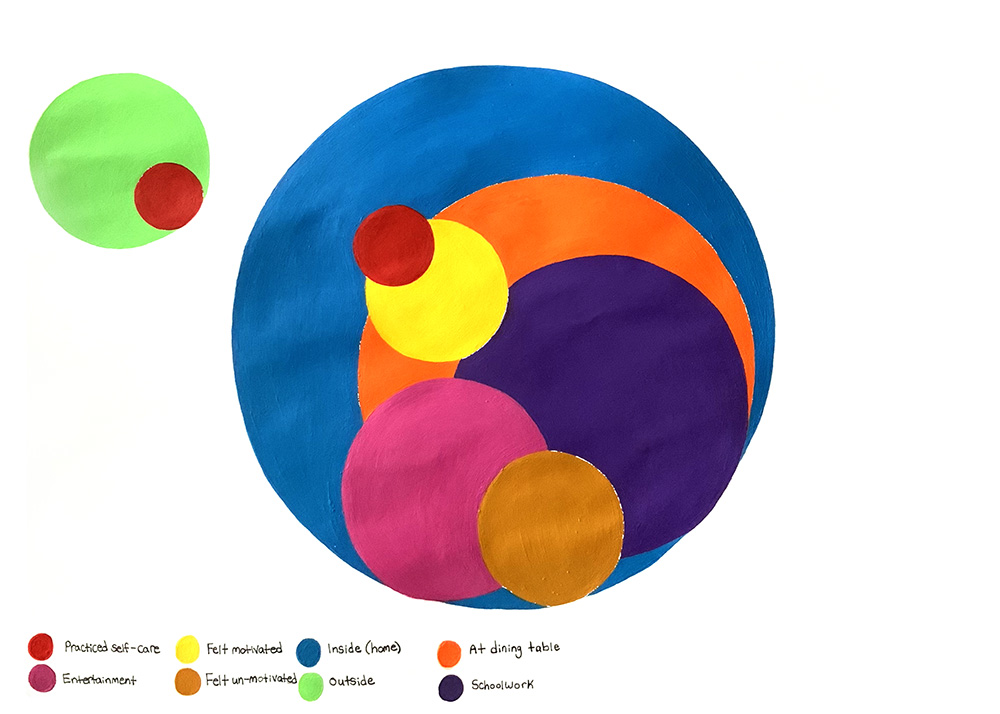
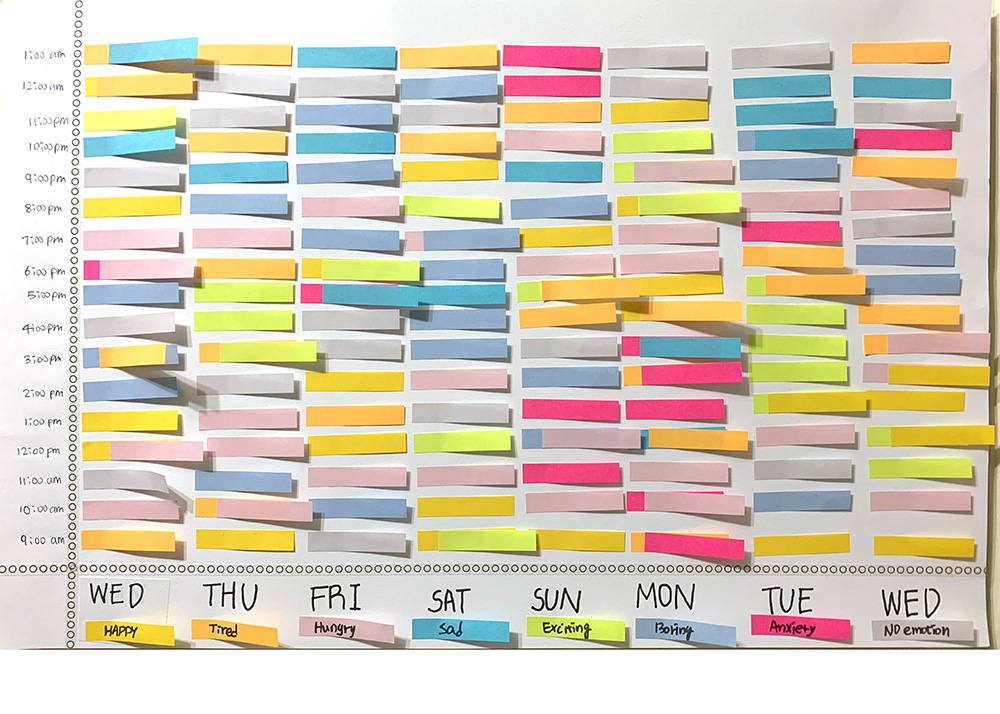
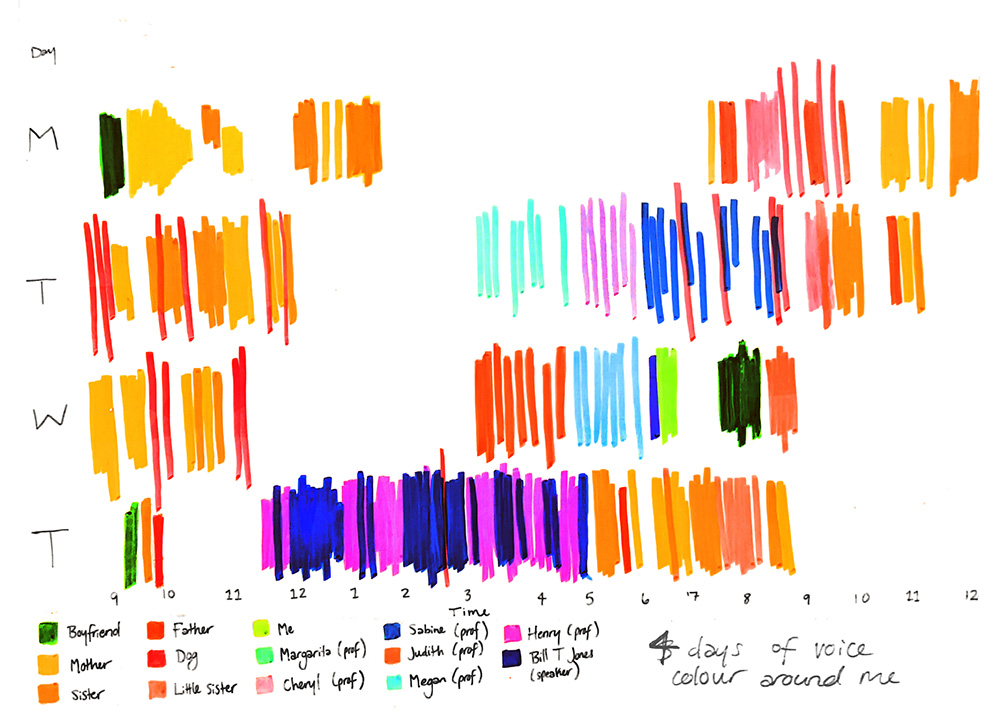
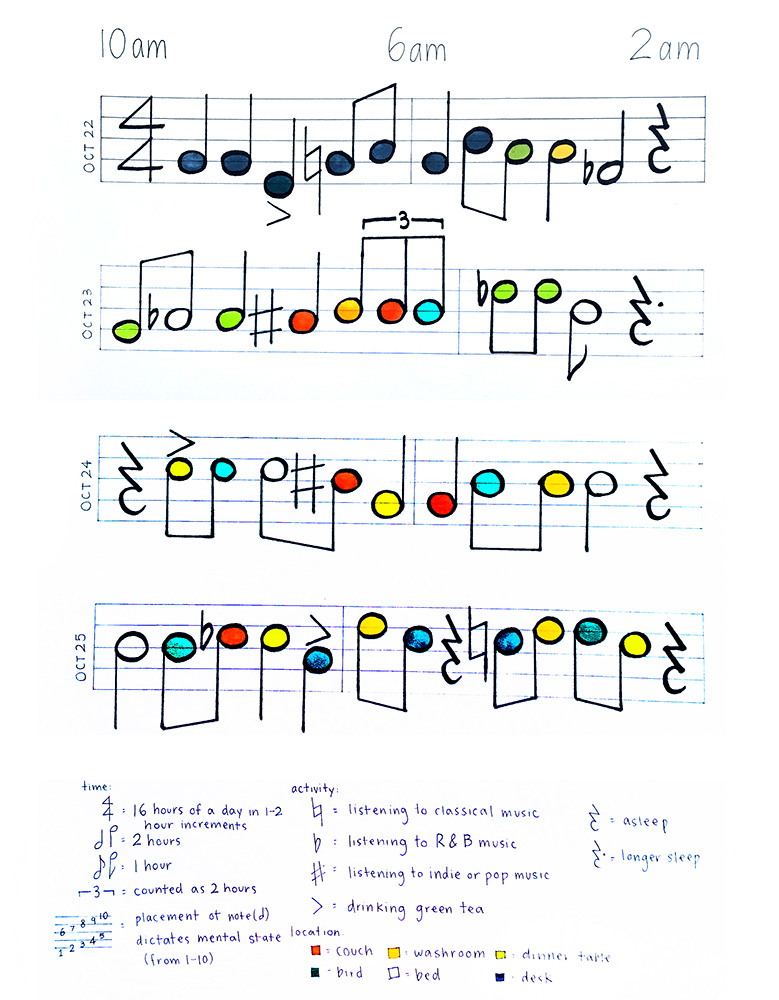
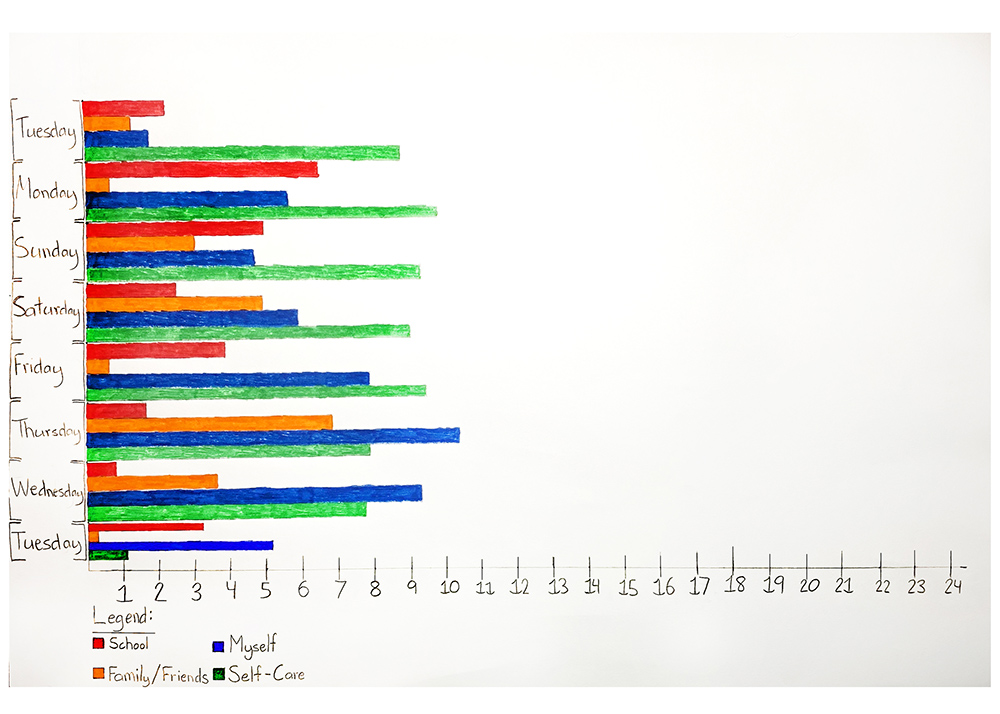
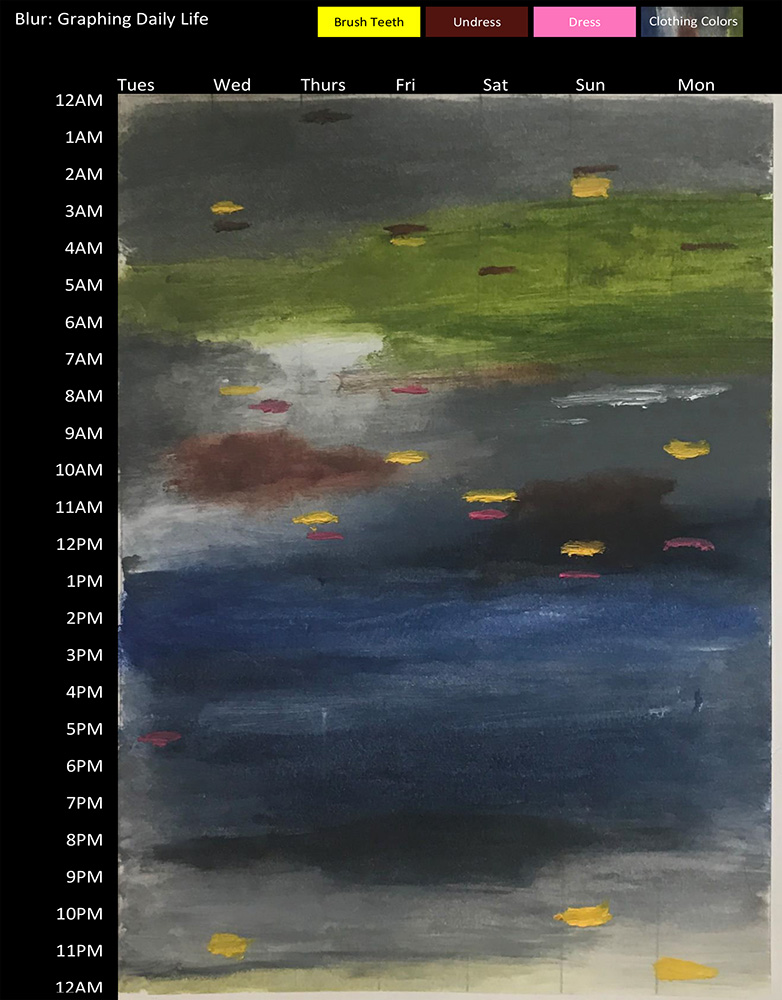
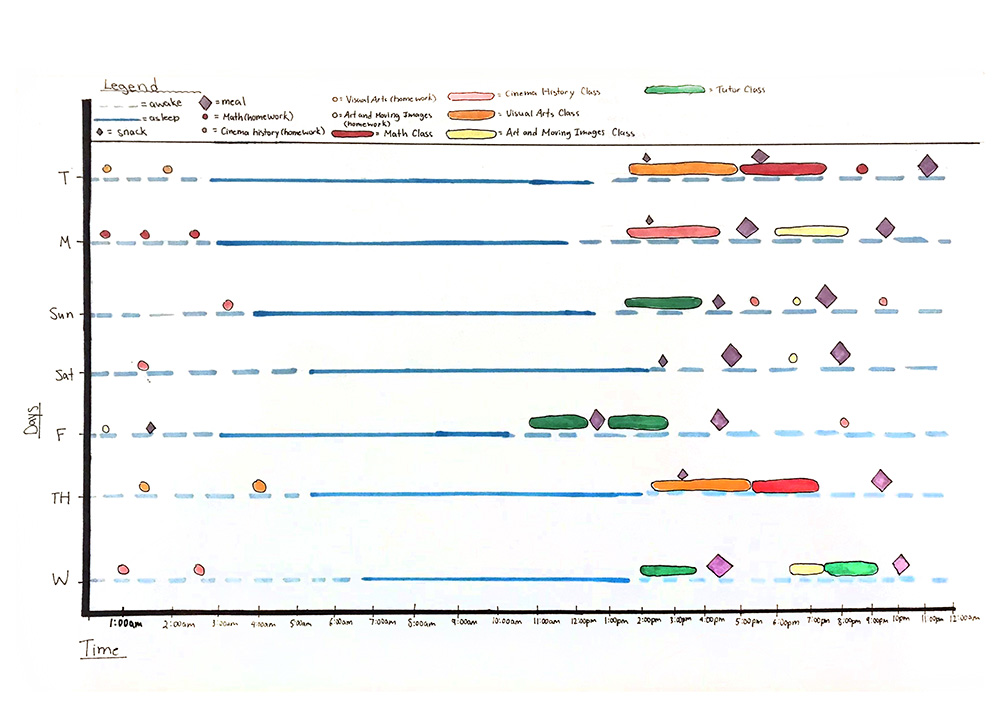
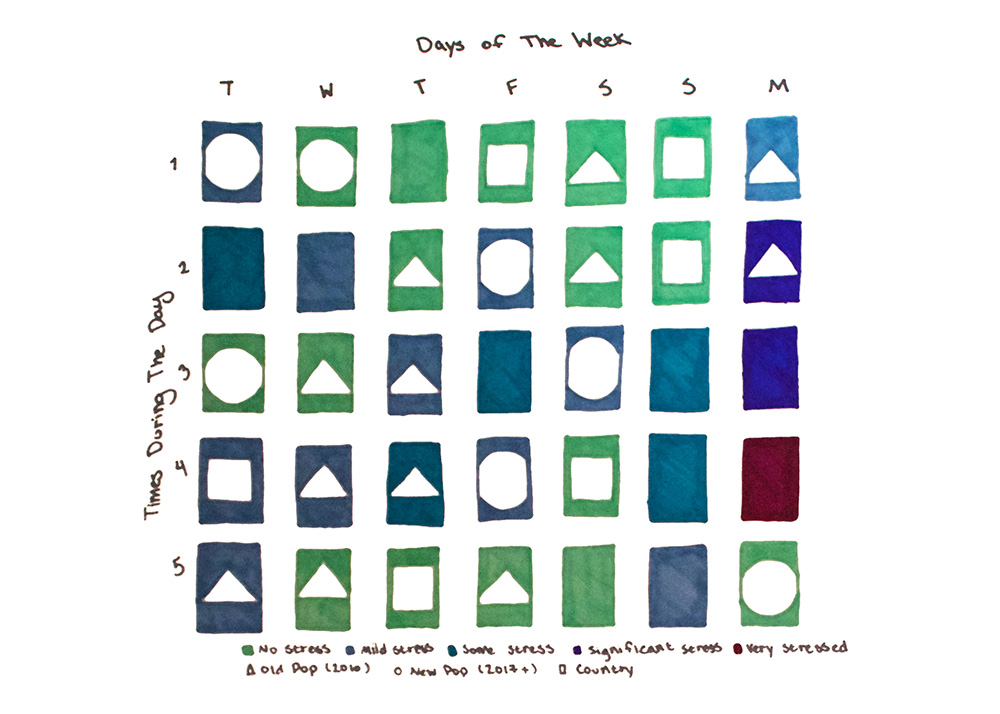
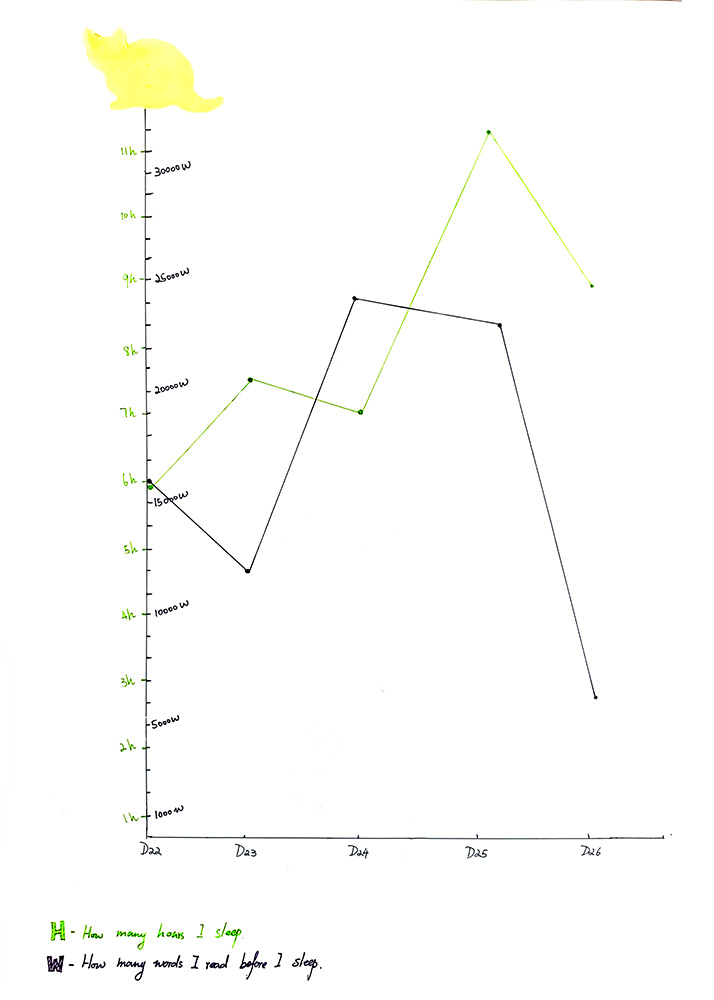
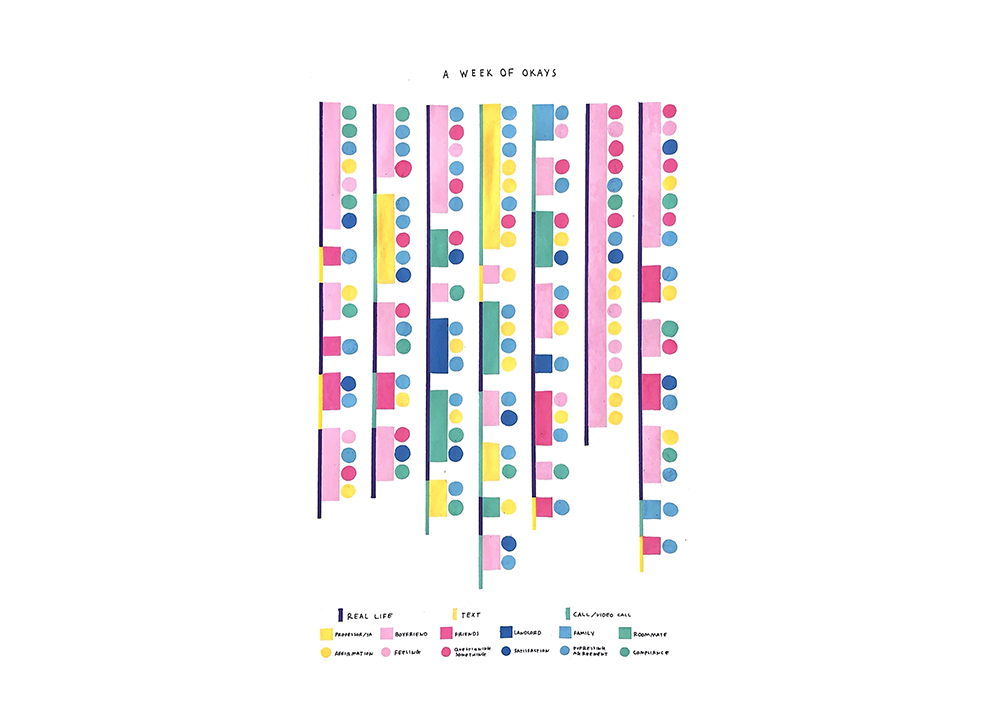
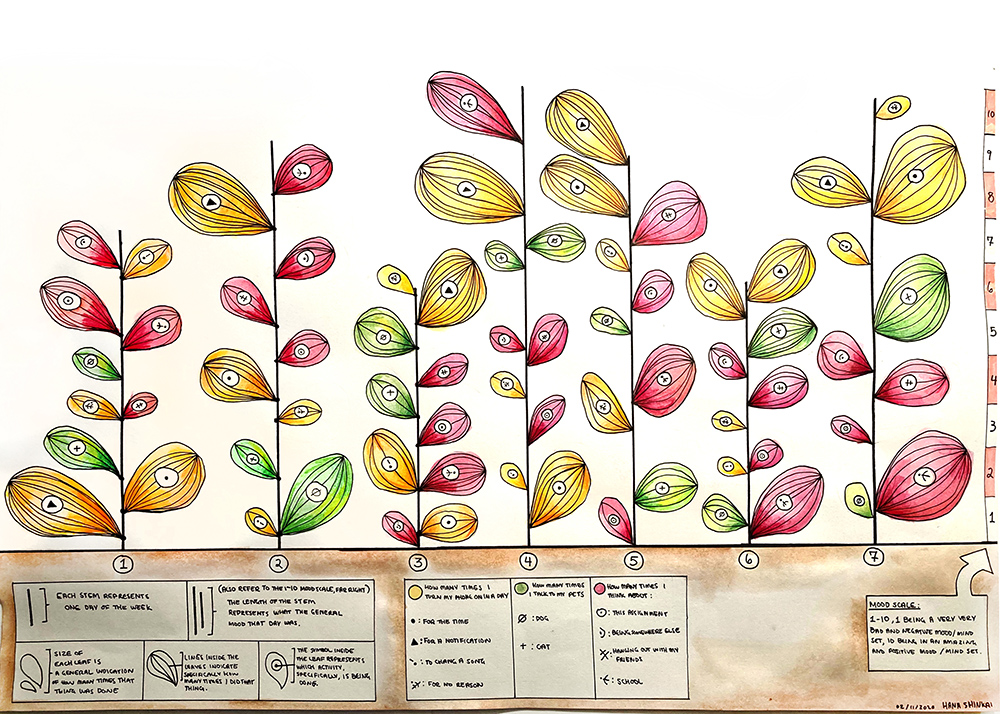
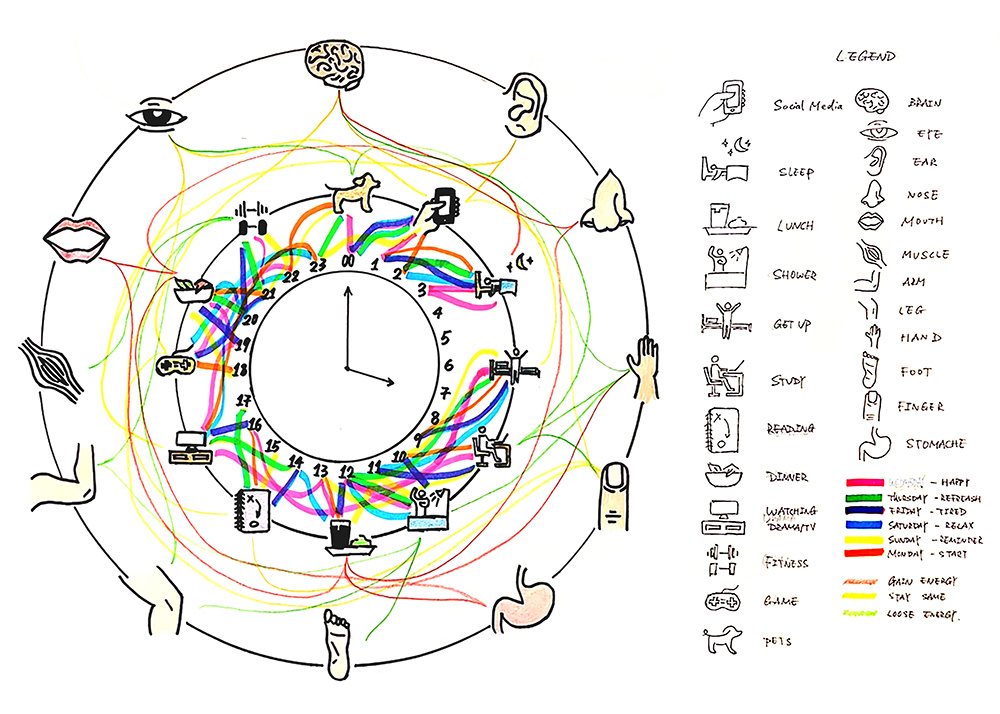
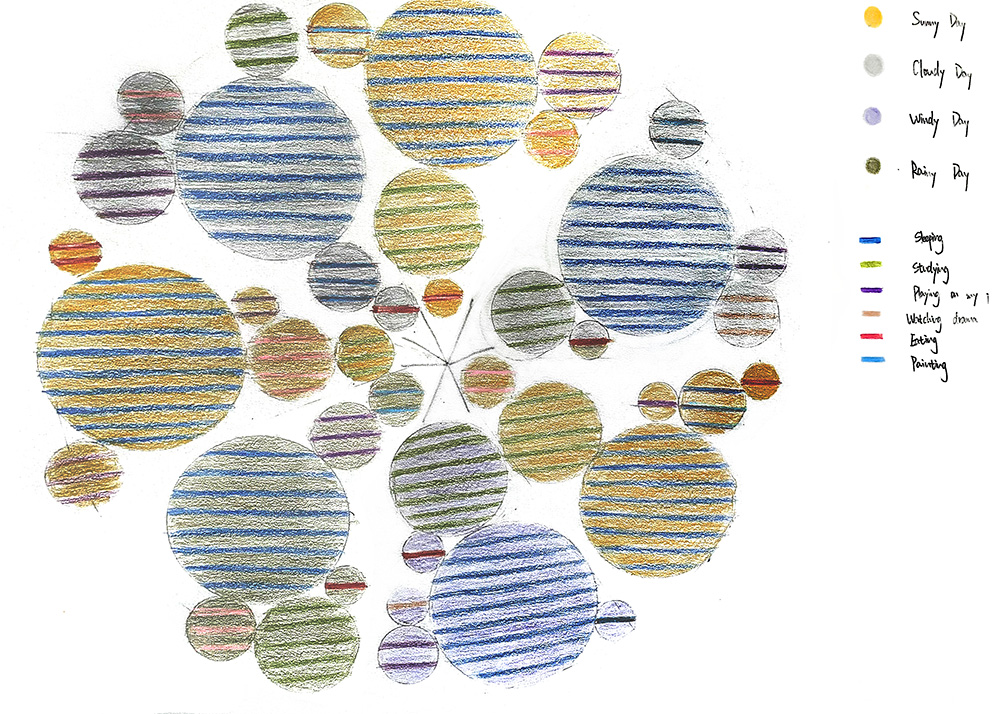
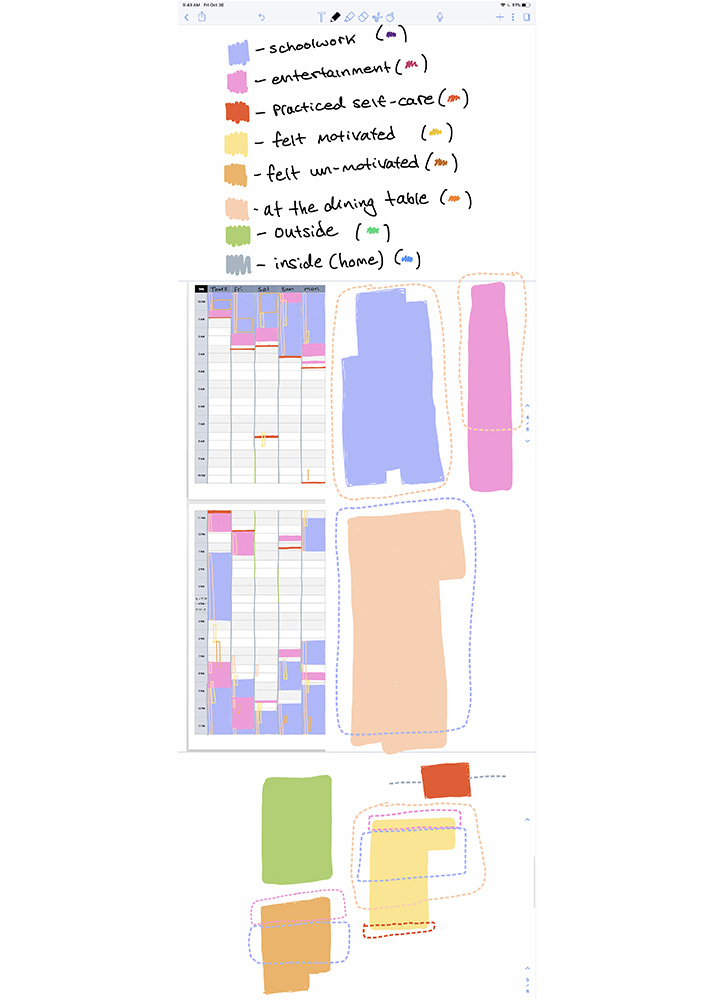
Make a 2D representation using your collected data as a complex graph. Use timeline, mapping, event, duration, altitude etc. on a single sheet of cartridge paper. Construct a representation as a sheet of visual information. The goal is to present the information as a clear graphic display that is easy to read and makes sense to a viewer. Do not use material to represent different functions, only use 2-dimensional graphic elements like lines, bars, shapes, colours, abstract symbols, etc.
Graphs by students in class CA160:
Noor Abouchehade
Yerin Choi
Natasha Dennison
Agnes Fan
Tye Gill
Henry Hart
Elizabeth Li
Daniel Molnar
Shana Qi
Quinton Qiu
Kinar Saragih
Carly Seemann

Hana Shinkai
Irene Weng
Minty Zhang
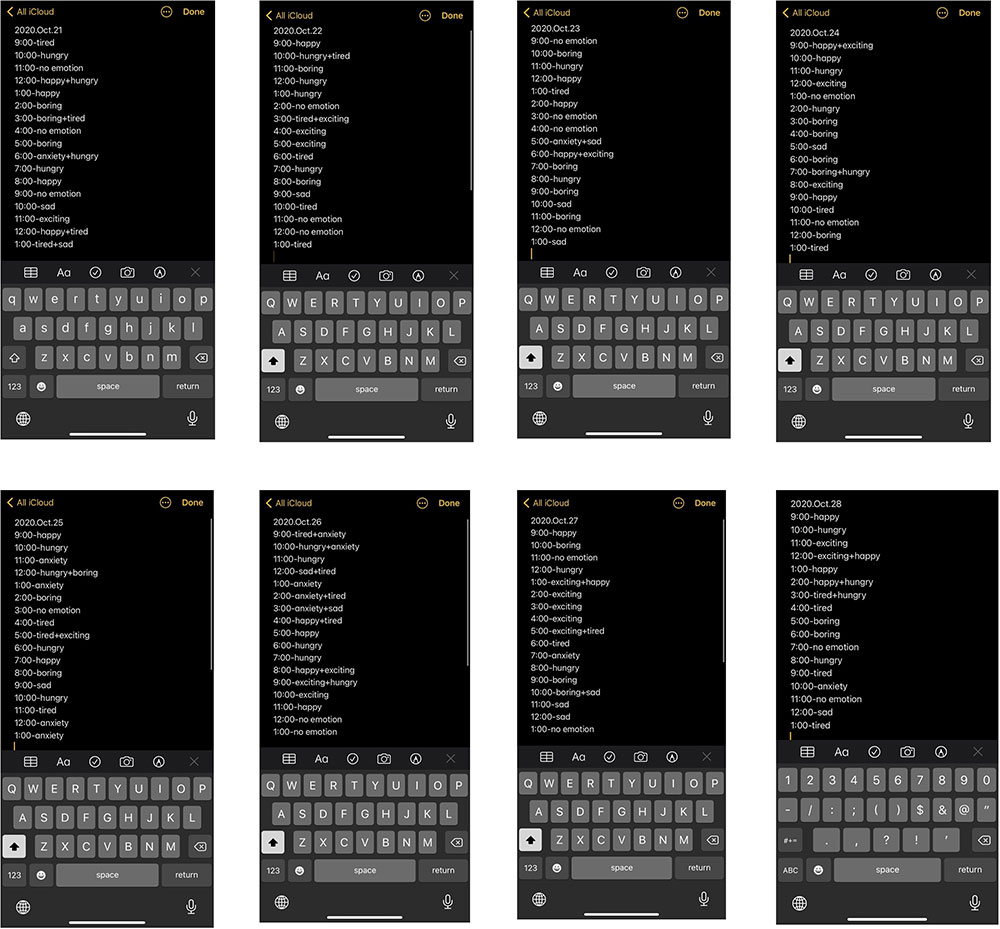
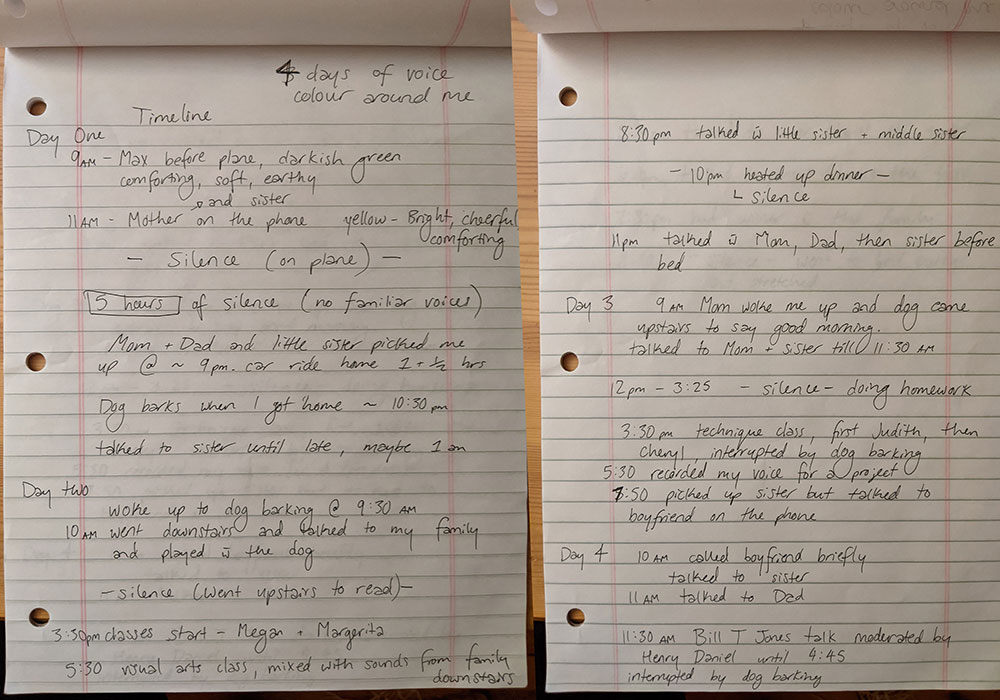
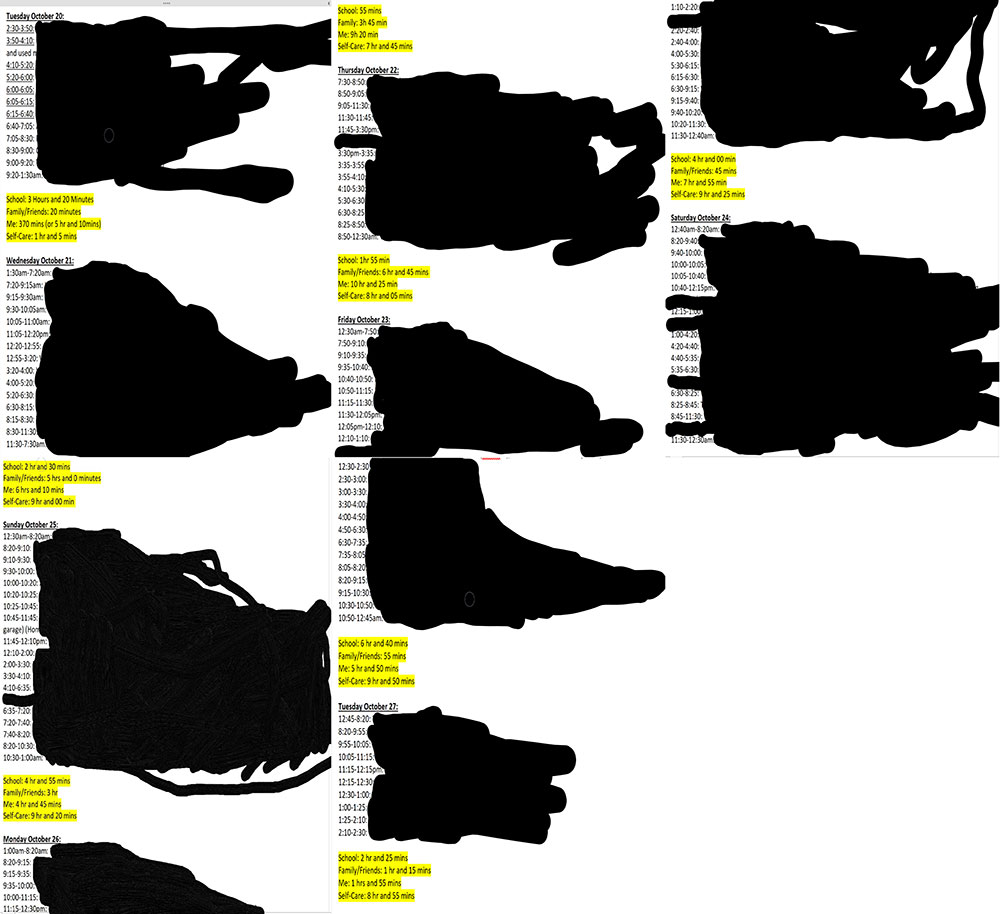
Time Dairies by students in class CA160:
Noor Abouchehade
Yerin Choi
Natasha Dennison
Agnes Fan

Tye Gill
Henry Hart
Elizabeth Li

Daniel Molnar
Shana Qi
Quinton Qiu

Kinar Saragih
Carly Seemann

Hana Shinkai
Irene Weng
Minty Zhang