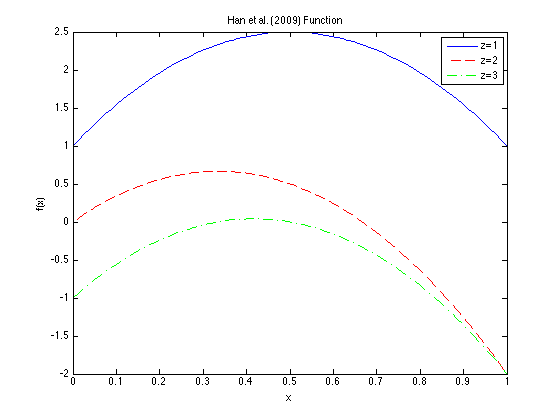
Han et al. (2009) Function
Description:
Dimensions: 2This function has one quantitative and one qualitative input variable. The plot above shows the function for all three possible values of the qualitative z-variable.
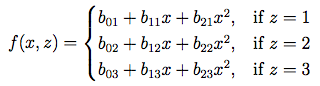
Zhou et al. (2011) and Han et al. (2009) use this function for three different scenarios, each time using a different b-vector (b01, b02, b03, b11, b12, b13, b21, b22, b23). For each scenario, the elements of the b-vector are drawn from Normal distributions with a standard deviation of 0.01 and the following expected values:
(1, 0, -1, 6, 4, 5, -6, -6, -6),
(1, 0, -1, 0, 6, 5, 2, -6, -6) and
(1, 0, -1, 6, 6, 6, -6, -6, -6).
The above plot is given for the first vector in the list.
Input Domain:
The quantitative variable x is in [0, 1], and the qualitative variable z takes on one of the three possible values in {1, 2, 3}.Code:
References:
Han, G., Santner, T. J., Notz, W. I., & Bartel, D. L. (2009). Prediction for computer experiments having quantitative and qualitative input variables. Technometrics, 51(3). 51, 278-288.
Zhou, Q., Qian, P. Z., & Zhou, S. (2011). A simple approach to emulation for computer models with qualitative and quantitative factors. Technometrics, 53(3).
For questions or comments, please email Derek Bingham at: dbingham@stat.sfu.ca.
LastUpdated
Copy