Steel Column Function
Description:
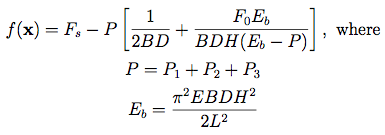
Dimensions: 9The Steel Column function models the trade-off between cost and reliability for a steel column.
The cost for the steel column is: Cost = b*t + 5*h, where b is the mean flange breadth, t (mm) is the mean flange thickness (mm), and h is the mean profile height (mm). The column length L is 7500 mm. Eldred et al. (2008) use the values b = 300, d = 20 and h = 300.
Input Distributions:
The (uncorrelated) input random variables and their distributions are:| Fs ~ Lognormal(mean=400, standard deviation=35) | yield stress (MPa) |
| P1 ~ N(μ=500000, σ=50000) | dead weight load (N) |
| P2 ~ Gumbel(mean=600000, standard deviation=90000) | variable load (N) |
| P3 ~ Gumbel(mean=600000, standard deviation=90000) | variable load (N) |
| B ~ Lognormal(mean=b, standard deviation=3) | flange breadth (mm) |
| D ~ Lognormal(mean=t, standard deviation=2) | flange thickness (mm) |
| H ~ Lognormal(mean=h, standard deviation=5) | profile height (mm) |
| F0 ~ N(μ=30, σ=10) | initial deflection (mm) |
| E ~ Weibull(mean=210000, standard deviation=4200) | Young's modulus (MPa) |
Above, N(μ, σ) is the Normal distribution with mean μ and variance σ2.
Code:
References:
Eldred, M. S., Webster, C. G., & Constantine, P. (2008, April). Evaluation of non-intrusive approaches for Wiener-Askey generalized polynomial chaos. In Proceedings of the 10th AIAA Non-Deterministic Approaches Conference, number AIAA-2008-1892, Schaumburg, IL (Vol. 117, p. 189).
Kuschel, N., & Rackwitz, R. (1997). Two basic problems in reliability-based structural optimization. Mathematical Methods of Operations Research, 46(3), 309-333.
For questions or comments, please email Derek Bingham at: dbingham@stat.sfu.ca.
LastUpdated
Copy