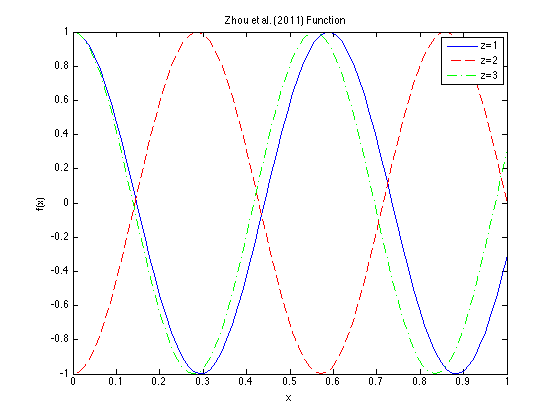
Zhou et al. (2011) Function
Description:
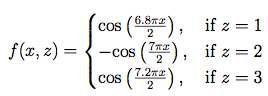
Dimensions: 2This function has one quantitative and one qualitative input variable. The plot above shows the function for all three possible values of the qualitative z-variable.
It can be seen that the curve of z = 2 is negatively correlated with the curves of z = 1 and z = 3, which are positively correlated with each other (Zhou, 2011).
Input Domain:
The quantitative variable x is in [0, 1], and the qualitative variable z takes on one of the three possible values in {1, 2, 3}.Code:
Reference:
Zhou, Q., Qian, P. Z., & Zhou, S. (2011). A simple approach to emulation for computer models with qualitative and quantitative factors. Technometrics, 53(3).
For questions or comments, please email Derek Bingham at: dbingham@stat.sfu.ca.
LastUpdated
Copy