Welcome to the Functional & Anatomical Imaging & Shape Analysis Lab (FAISAL)
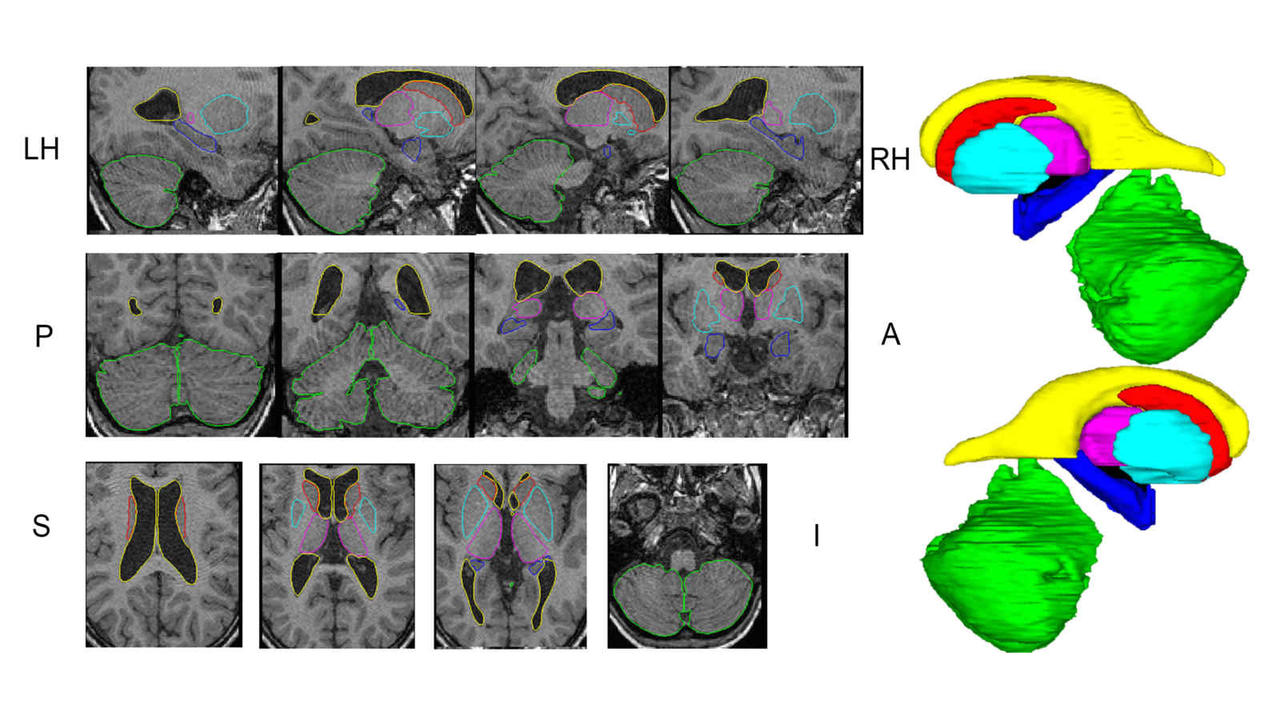
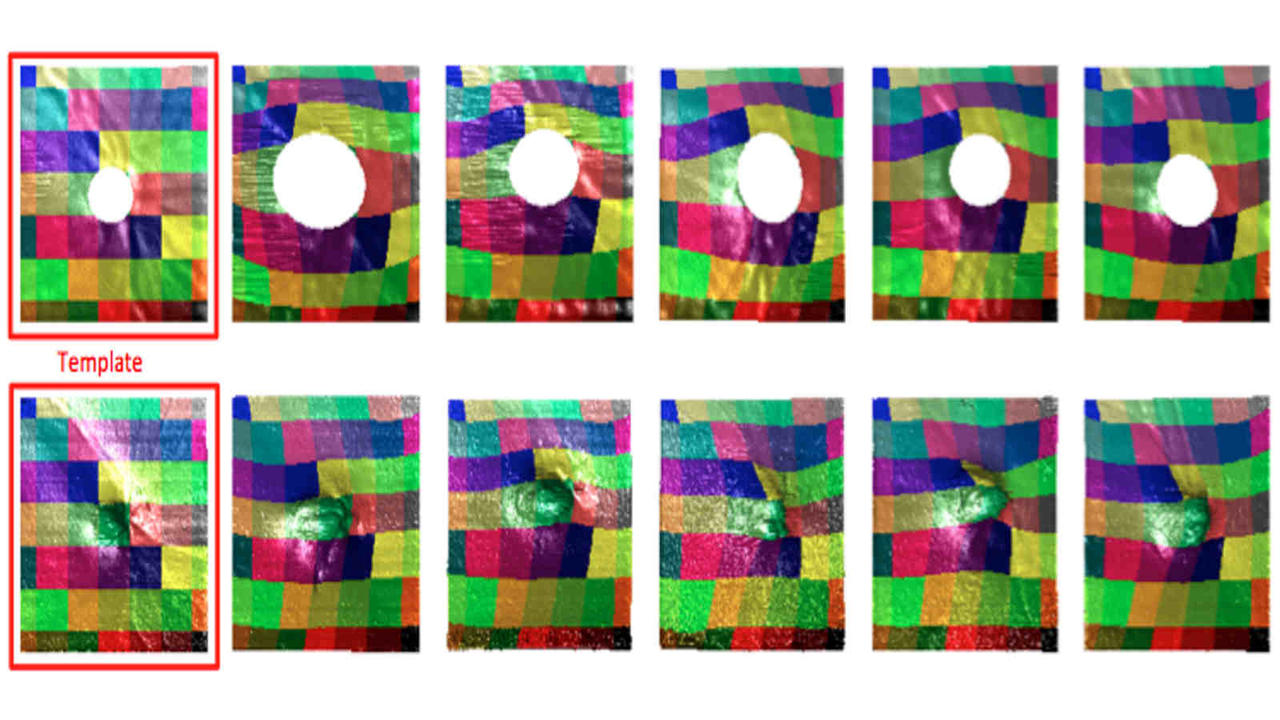
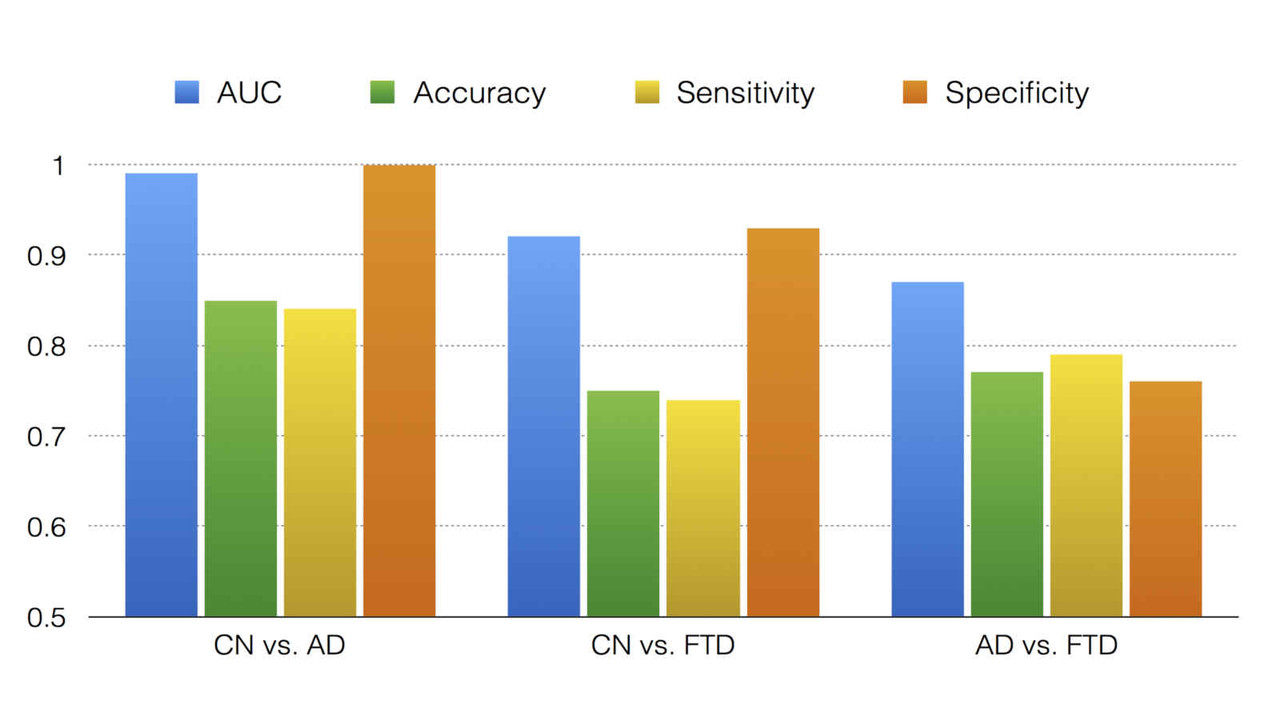
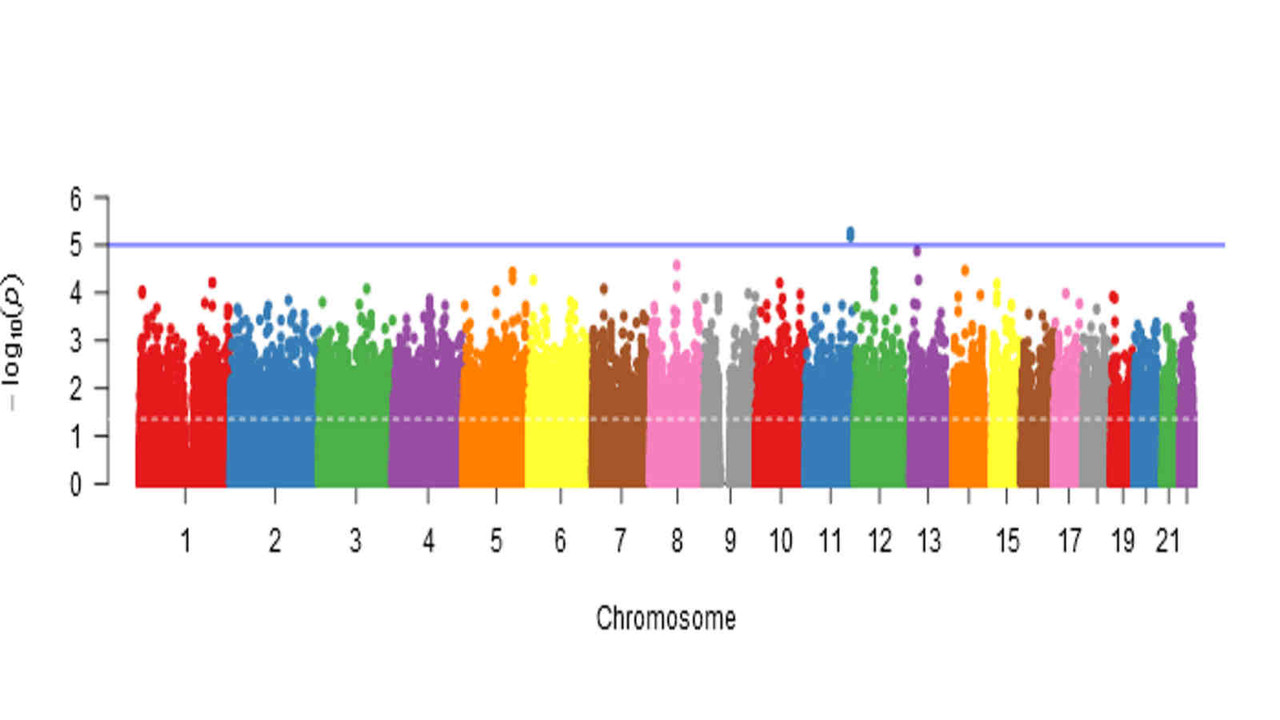
Modern medical imaging modalities generate exquisite images of in-vivo internal anatomy. Magnetic resonance imaging (MRI), Optical Coherence Tomography (OCT) images, Positron Emission Tomography (PET) to name a few are 3D modalities that allow us to look inside the living human body and visualize structure and function. The goal of our lab is to use signal processing and computational techniques to make measurements in images, turning pictures into data. These data can be used to design classifiers for early detection of disease, to monitor the progression of a disease or to monitor the efficacy of a treatment. Our main focus is to study the brain (MRI/PET) and retina (OCT) images, and design computational imaging biomarkers using these images for the applications in dementia and glaucoma diagnosis.
The lab PI is Dr. Mirza Faisal Beg, who got his PhD in Biomedical Engineering from the Johns Hopkins University, Biomedical Engineering Program. There, he had the unique opportunity to take the first year medical school curriculum with the Johns Hopkins Class of 2001. Combining expertise in engineering methods and the knowledge gained in his medical school courses, he leads the lab that bring the power of engineering and computational methods to build translational tools for clinical utility.
Our lab is enriched through strong collaborations with neuroscientists, clinicians, computer vision experts and mathematicans from both Canada and around the world.
We are looking for motivated PhD, Masters and Undergraduate students to join the team, see openings!
News
12 April 2023NEW publication in nature medicine
Body composition and lung cancer-associated cachexia in TRACERx
NEW publication in Computers in Biology and Medicine
Segmentation-guided domain adaptation and data harmonization of multi-device retinal optical coherence tomography using cycle-consistent generative adversarial networks
NEW publication in Journal of Glaucoma
Effects of Myopia and Glaucoma on the Neural Canal and Lamina Cribrosa Using Optical Coherence Tomography
NEW publication in Journal of Alzheimer's Disease
Longitudinal Spatial Relationships Between Atrophy and Hypometabolism Across the Alzheimer’s Disease Continuum
NEW publication in Neurobiology of Aging
Predicting time-to-conversion for dementia of Alzheimer's type using multi-modal deep survival analysis
NEW publication in Brain Communications
White-matter abnormalities in presymptomatic GRN and C9orf72 mutation carriers