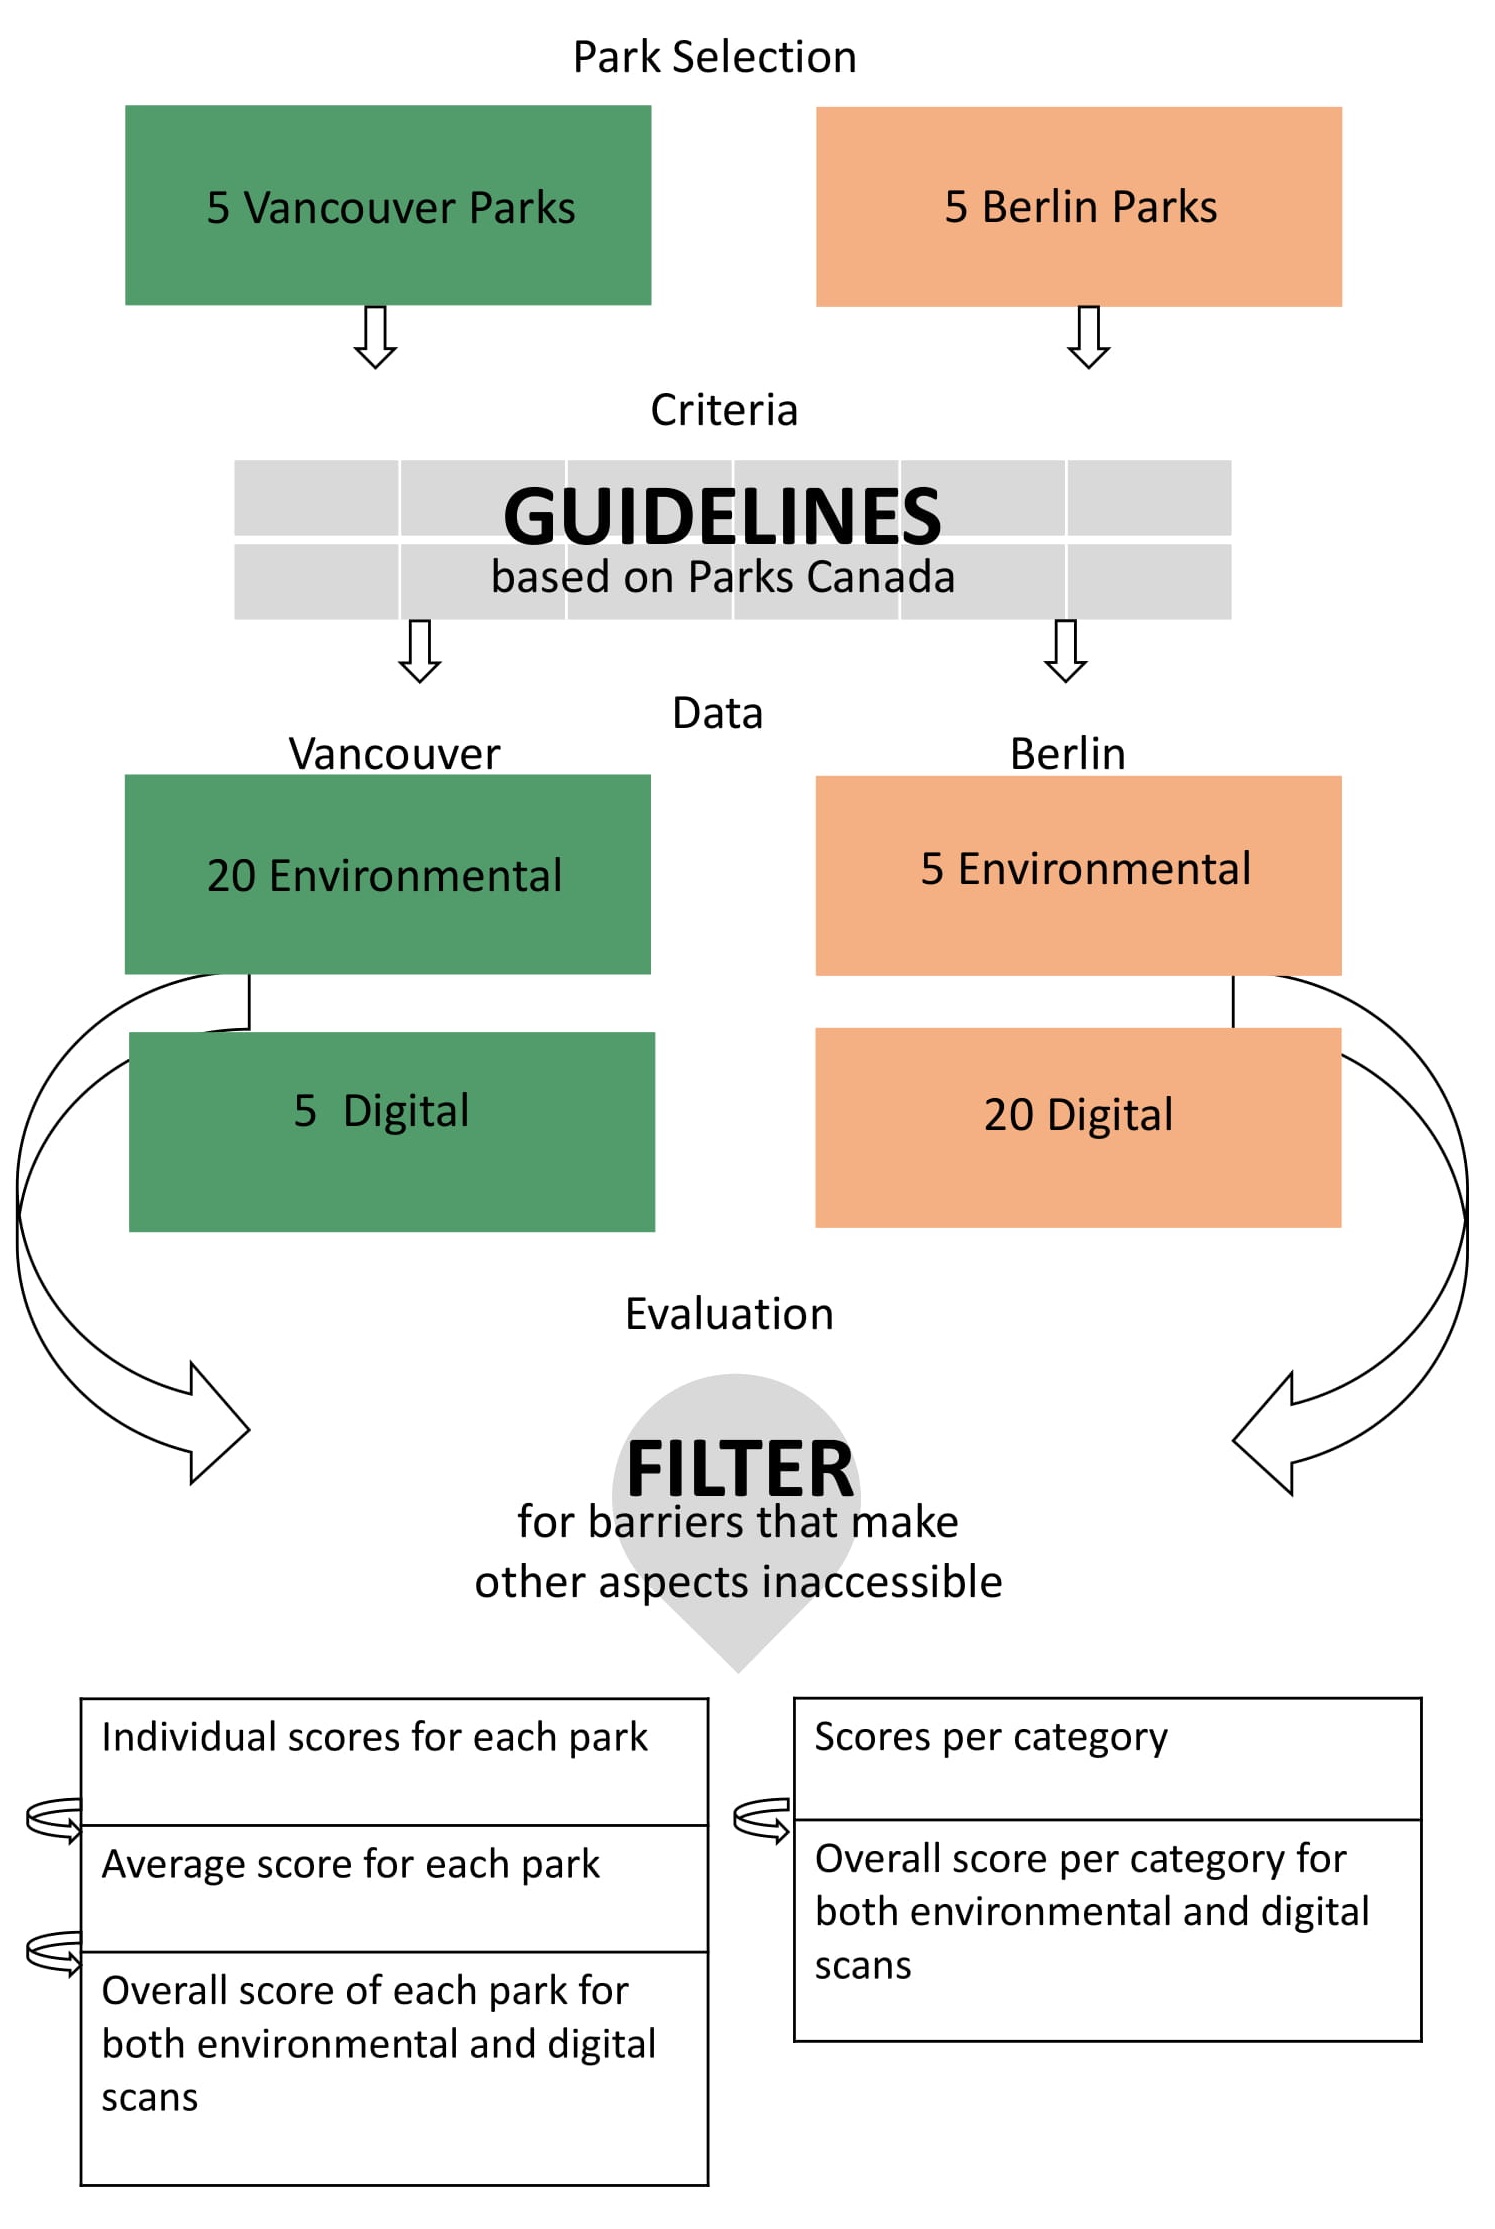
For this project environmental audit data was collected in Vancouver by students from Simon Fraser University. Environmental scans of Berlin parks were done by students from Humboldt University. For the digital scans, Canadian students evaluated Berlin Parks and German students evaluated Vancouver Parks. This was done in order to understand the capabilities of digital audits for wheelchair accessibility audits.
Park Selection
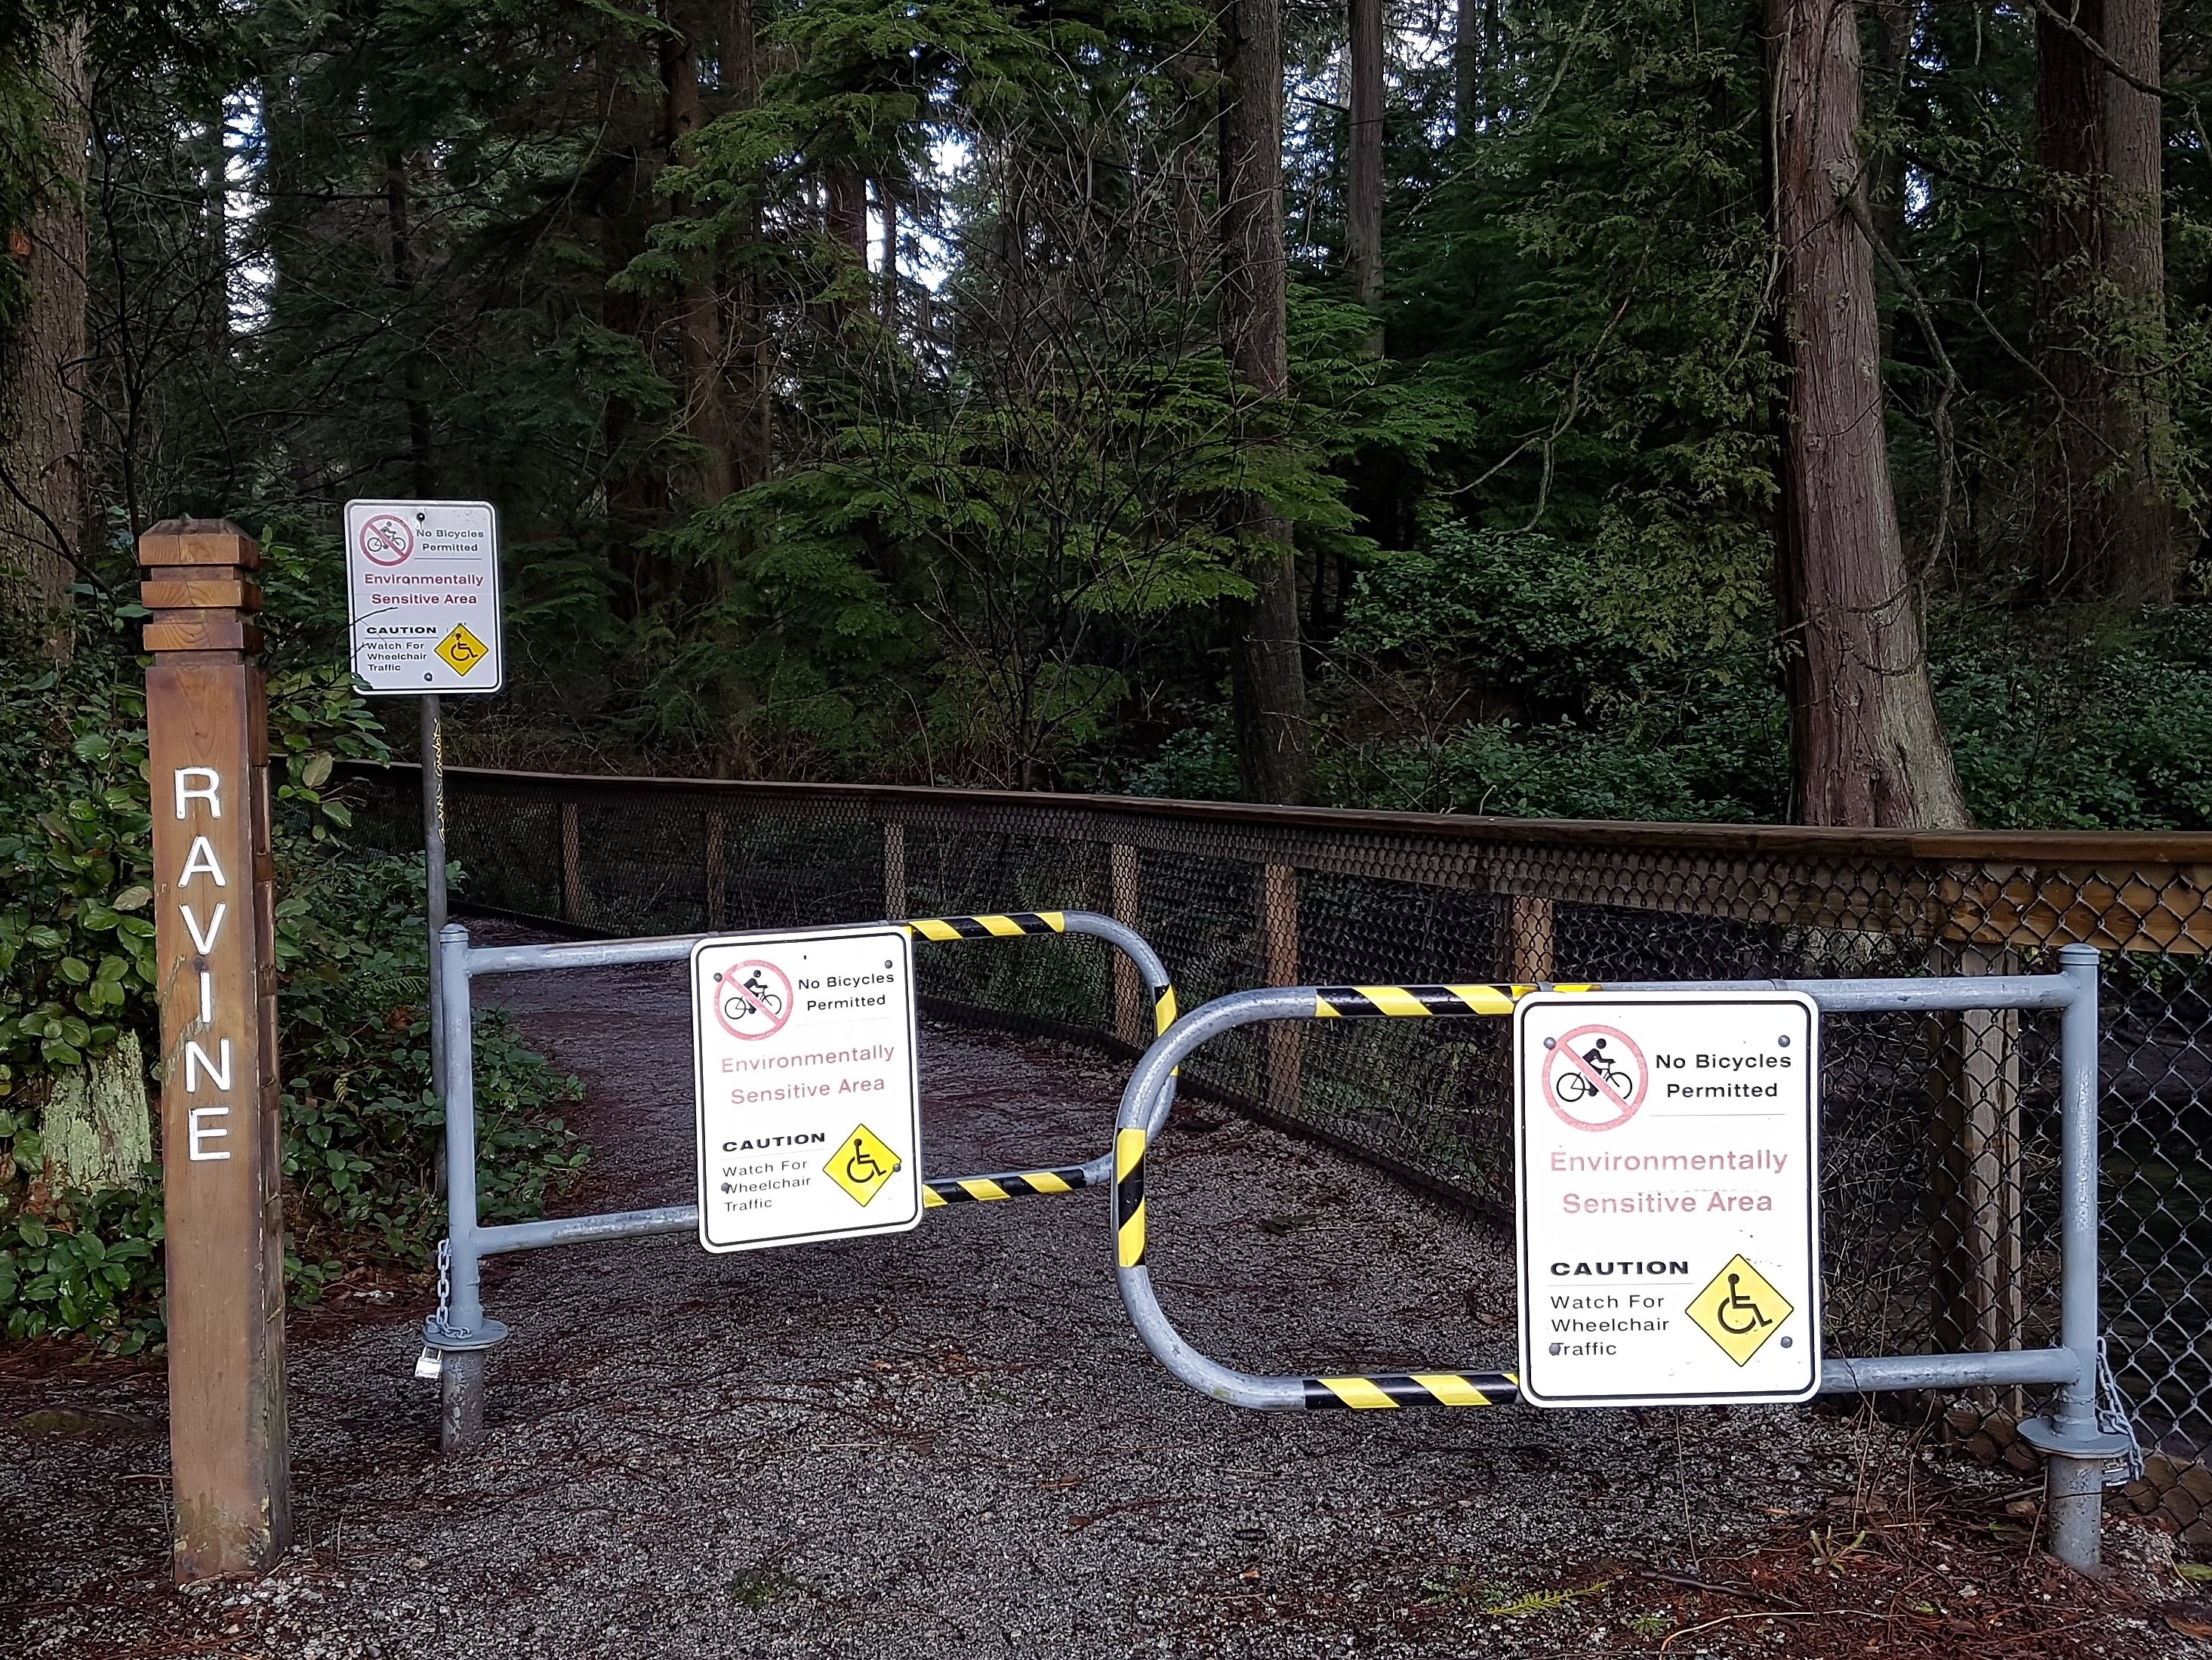
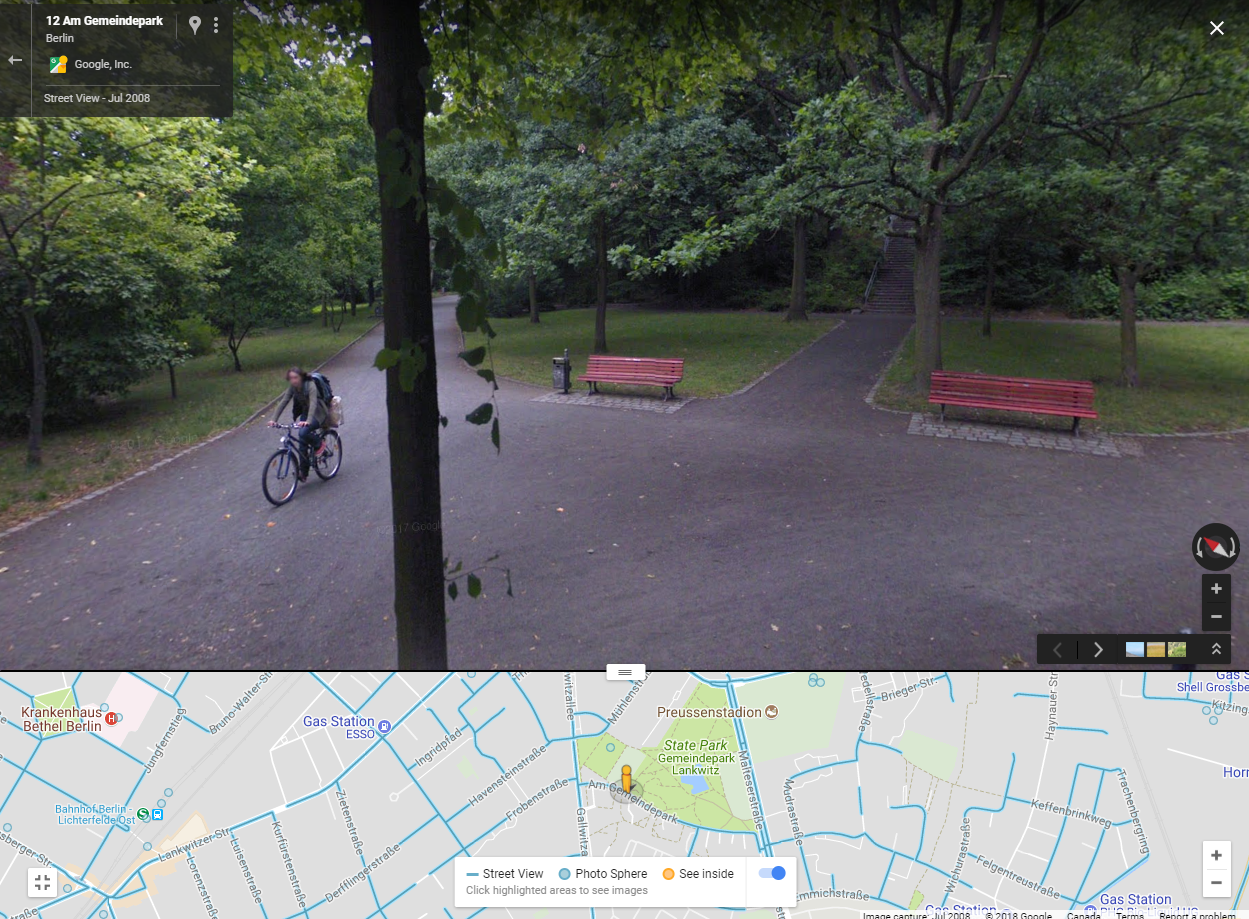
Five green spaces were selected for analysis and data acquisition in Vancouver and five in Berlin. Parks were selected based on their varying size, cultural importance, location within the city, and their level of use. Parks in Vancouver were audited in-person by Candian students, and digitally by German students. For Berlin parks, German students collected data, and Canadian students used digital assessment means. Below are the maps illustrating location of each of the parks assessed. Below are maps presenting location of each of the parks assessed for this study.
Vancouver Parks
Berlin Parks
Guidelines and Data
Criteria and guidelines were created specifically for this project to rate green spaces with scores of 0-5 for different aspects of infrastructural design encompassing wheelchair accessibility. Data acquisition for environmental scans was collected individually by group members, with written observations, quantitative scores, and photos of areas of interest. Digital scan data was collected through digital mediums that include sources like Google Maps in Street View mode, OpenStreetMap, Wheelmap and geo-tagged photos. The full criteria and guidelines used for this study can be found here: PDF for guidelines and criteria .
Evaluation
There are three parts to the evaluation process of this study:
- 1. Scores retrieved from digital and environmental scans for each city’s green spaces were combined, where the differences in wheelchair accessibility between the two cities were analyzed and interpreted.
- 2. Differences in observations between environmental and digital scans of the same green space were analyzed.
- 3. Scores for each category between environmental scans and digital scans were analyzed to compare the accessibility of each category to identify any differences between categories.