Of all journeys in the GVRD in 2000, some 83% were taken
by private automobile, 9% by public transit, and 8% by foot and bicycle (combined)
(GVRD, 2001b). Within the GVRD, transit use varies considerably by
municipality. Within the city of Vancouver, where population and employment
densities are the highest in the region, the all day transit share of travel
is estimated at around 17%. Burnaby and New Westminster are in the range
of 13%, while the lower density suburban areas have significantly lower transit
mode shares in the range of 2 - 8%. Throughout the GVRD, use of public transit
on a per capita basis in 2000 had not improved, rather, it had declined,
from 67 trips per capita in 1991 to 64 trips per capita in 2000 (GVRD, 2001a).
According to 1999 survey results, the total number of vehicles on Lower
Mainland roads during the a.m. peak period is 363,946; the total number
of vehicle passengers (not including driver) is 135,443; and the average
occupancy per 100 vehicles is 137. In the GVRD, the number of insured vehicles
went up from 1, 021, 200 making 4, 780, 100 trips per day in 1994, to 1,
180, 400 insured vehicles making 5, 478, 400 trips per day in 1999
(GVRD, 2001c).
Further, vehicle ownership
not only continues to increase in the GVRD, it is doing so faster than
the growth in population, that shows a slight upward trend of automobile
ownership, with a ratio of 0.59 vehicles per person in 1999, up from 0.57
per person in 1994. The just released 2002 annual report of the LRSP shows
that vehicles continue to proliferate in the region, stating that in January
of 2002, there was a 1.9 per cent increase in licensed vehicles in the region,
compared with an estimated 1.3 per cent increase in population. (The Georgia
Straight, 03/04/03; 12). Further, the increase in automobile trips from 1994
to 1999 (14.6%) was greater than the growth in population (10.6%) for the
same period 1994 (GVRD, 2001c). Data provided by trip diary surveys conducted
in 1994 and 1999 show a slight increase in the proportion of trips made by
public transit in the morning peak, from 11.3 per cent of all trips to 12.5
per cent in 1999 (GVRD 1999). However, A 1999 Translink discussion paper
showed that transit mode share has remained more or less unchanged in the
last 10 years at 11 per cent, but with some growth in the mid-day and evening
where transit mode share shifted slightly from 8 to 10 per cent (Translink,
1999). Between 1985 and 1996, there appears to have been little change in
the proportion of automobile drivers, and a gradual worsening of automobile
occupancy. In other words, there are just as many cars per capita on the
road, but they are carrying a smaller proportion of all work commuters.
Census data and trip diary surveys show that non-motorized modes of travel
have improved somewhat.
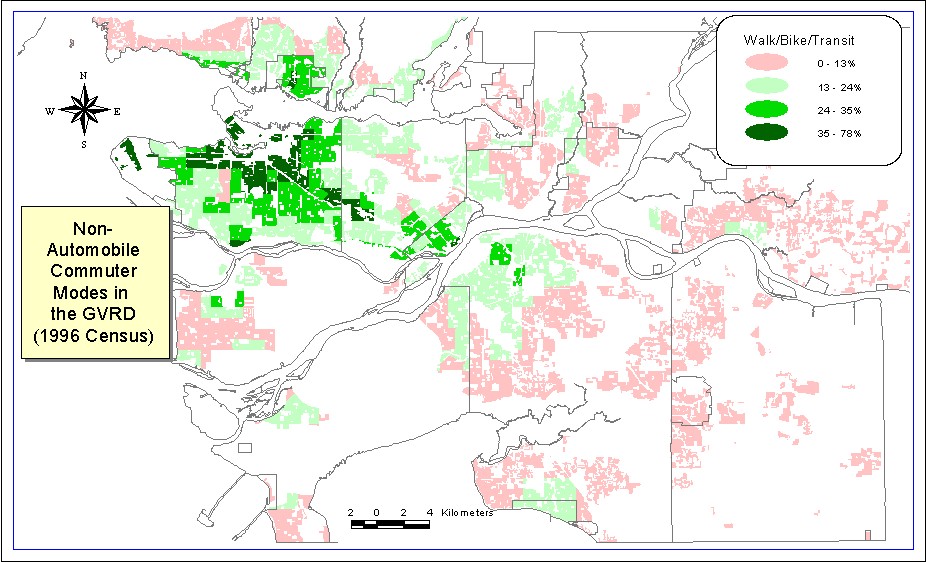
A more comprehensive picture of commuter
patterns, which make up approximately 1/3 of all trips made in the region,
is given by 1996 census data for the Vancouver CMA (GVRD, 1999).
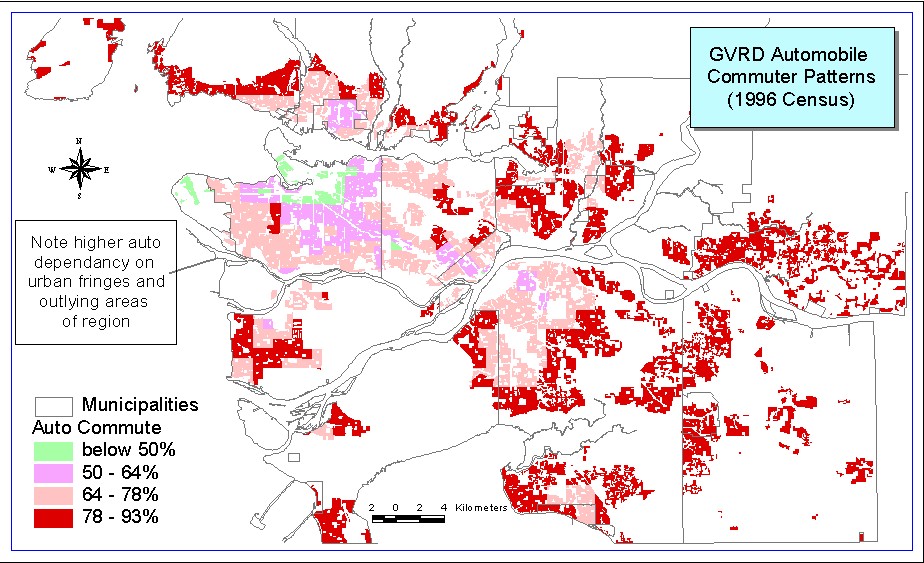
In 1996, 77.2 per cent of work trips made outside the home were made by
automobile; 70.6 per cent as driver and 6.6 per cent as passenger. Public
transit made up made up 14.3 per cent of work trips, walking 5.8 per cent,
bicycle 1.7 per cent, and other modes 1.0 per cent. Between 1985 and 1996,
automobile driver commuter mode share was essentially unchanged, while automobile
passenger mode share declined sharply from 10.3 per cent to 6.6 per cent,
indicating a less efficient use of automobiles for commuting. There were
very modest increases in public transit mode shares from 13.1 per cent to
14.3 per cent, and non-motorized mode shares from 5.6 per cent to 7.5 per
cent.
Census data also shows that a dispersed
pattern of sub-regional travel in the region, a defining characteristic
of suburban sprawl, continued to increase in the GVRD up to the 1996 census.
Over the three decades prior to 1996, progressively more work trips were
crossing sub-regional boundaries and major water boundaries (transportation
bottle necks), and occurred outside the central city. The proportion of
trips with both a suburban origin and a suburban destination indicate the
degree of dispersal in the regional journey to work: 35.0 per cent in 1971,
and 51.6 per cent in 1996. Sub-regional work trip patterns also indicate
that low percentages of trips are captured within home sub-regions. A progress
report undertaken by the GVRD and Translink showed that between 1985 and
1996, City-City travel in the GVRD grew by 28%, City-Suburb travel grew by
26%, and Suburb-Suburb travel grew by 46%, indicating a continued dispersal
of activity and transportation patterns (GVRD, 2001c).
The proportion of work trips arriving in
each sub-region by each mode shows that the City of Vancouver and the University
Endowment Lands together had the highest transit mode share (26.2 per cent)
and the lowest automobile driver mode share (56.1 per cent). All other
sub-regions were below the regional average (14.3 per cent). Municipal
mode shares show similar patterns. Interestingly, for many cities and sub-regions
within the GVRD, walking and biking, or automobile passenger, make up more
work trips than by public transit.
Commuter mode shares of major regional centres,
i.e. downtown and the eight regional town centres, or RTC’s, reflects a
similar pattern to commuter mode shares of the GVRD sub-regions mentioned
above. The downtown core is the only area of the region where non-automobile
commuter mode shares (50.7 per cent) are greater than automobile commuter
mode shares (48.6 per cent). Among RTC’s, only Metro Town has a transit
mode share above 20 per cent, or indeed above the regional average of 14.3
per cent (GVRD, 1998a).
|