Archaeological Site Potential in the Ottawa Region
An Exercise
RESULTS
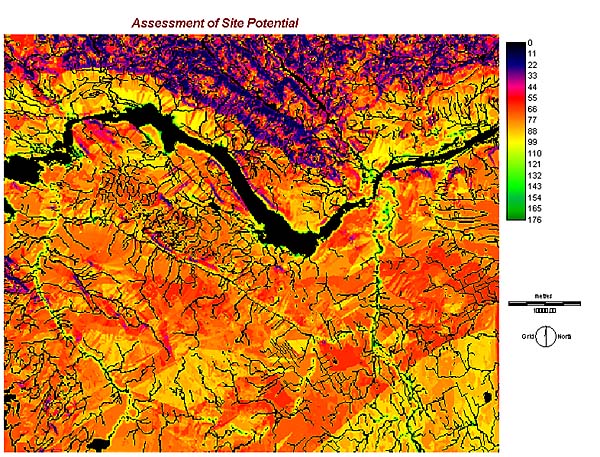
Running MCE resulting in the following map assessing the potential for an area's suitablity for locating sites:
This map was then ranked using the RANK module to produce the following map:
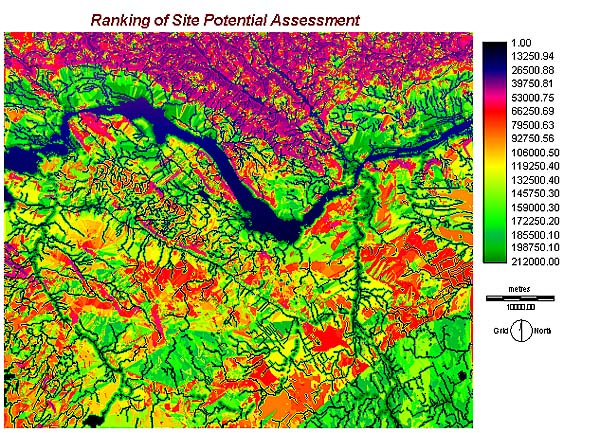
Once this step was completed, I wanted to find areas of high, medium and low suitability for site location. The method I chose was arbitary but simple and sufficient for this purposes of this project. I ran a QUERY of known sites against the ranked map. The resulting histogram(s) showed that the majority of sites were located in rankings from 21200 to 200500. Following a large gap, the final two sites showed up at 146780 and 150,100. I arbitrarily divided the difference between 212000 and 146780 by three to create my three classes of high (212000 to 190260), medium (190260 to 168520) and low potential areas (16850 to 146780) where sites might be found. Before I could reclass the map, however, I had to STRETCH it to fit the byte 0-255 scale. The same logic applied once the map had been STRETCHED - three classes of 255 to 229 (high), 229 to 203 (medium) and 203 to 177 (low) were created.
This resulted in the following map:
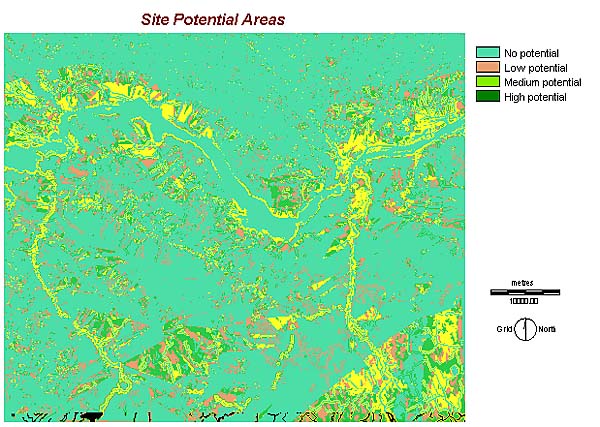
While I realize that this has created an artifical, and empty, medium potential zone, at the very least, this map gives you some idea of the areas where your potential to find sites is high - and could form the basis for future study or the design of a site survey project.
Back Onward