Chapter Contents
Previous
Next
|
Chapter Contents |
Previous |
Next |
| Multiple Regression |
| Choose Graphs:Partial Leverage. |
This displays the graphs shown in Figure 14.9.
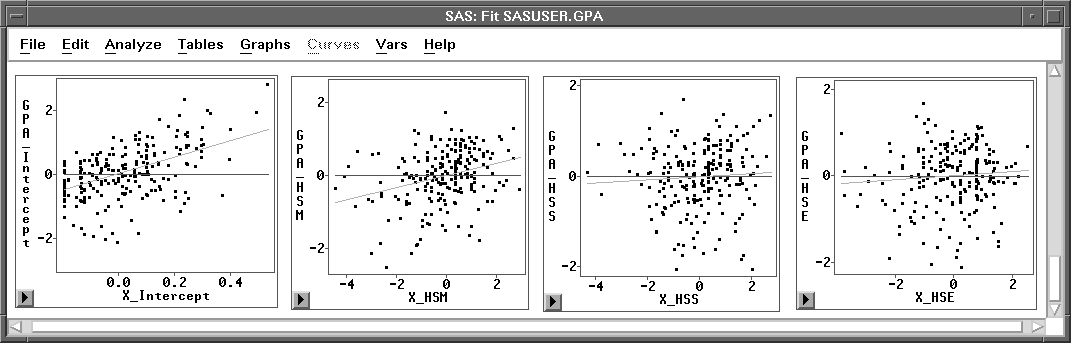
In each plot in Figure 14.9, the x-axis represents the residuals of the explanatory variable from a model that regresses that explanatory variable on the remaining explanatory variables. The y-axis represents the residuals of the response variable calculated with the explanatory variable omitted.
Two reference lines appear in each plot. One is the horizontal line Y=0, and the other is the fitted regression line with slope equal to the parameter estimate of the corresponding explanatory variable from the original regression model. The latter line shows the effect of the variable when it is added to the model last. An explanatory variable having little or no effect results in a line close to the horizontal line Y=0.
Examine the slopes of the lines in the partial leverage plots. The slopes for the plots representing HSS and HSE are nearly 0. This is not surprising since the coefficients for the parameter estimates of these two explanatory variables are nearly 0. You will examine the effect of removing these two variables from the model in the section "Modifying the Model" later in this chapter.
Curvilinear relationships not already included in the model may also be evident in a partial leverage plot (Rawlings 1988). No curvilinearity is evident in any of these plots.
|
Chapter Contents |
Previous |
Next |
Top |
Copyright © 1999 by SAS Institute Inc., Cary, NC, USA. All rights reserved.
![[menu]](images/regeq17.gif)