Chapter Contents
Previous
Next
|
Chapter Contents |
Previous |
Next |
| Using the Output Delivery System |
Suppose that you are analyzing a 4x4 factorial experiment for an industrial process, testing for differences in the number of defective products manufactured by different machines using different sources of raw material. The data set Experiment is created as follows:
   data Experiment;
      do Supplier = 'A','B','C','D';
         do Machine = 1 to 4;
            do rep = 1 to 5;
               input Defects @@;
               output;
               end;
            end;
         end;
      datalines;
    2  6  3  3  6  8  6  6  4  4  4  2  4  0  4  5  5  7  8  5
   13 12 12 11 12 16 15 14 14 13 11 10 12 12 10 13 13 14 15 12
    2  6  3  6  6  6  4  4  6  6  0  3  2  0  2  4  6  7  6  4
   20 19 18 21 22 22 24 23 20 20 17 19 18 16 17 23 20 20 22 21
   ;
Suppose that you are interested in fitting a model to determine the effect that the supplier of raw material and machine type have on the number of defects in the products. If the F test for a factor is significant, you would like to follow up with a multiple comparisons procedure. Thus, the tables of interest are the model ANOVA and the multiple comparisons output.
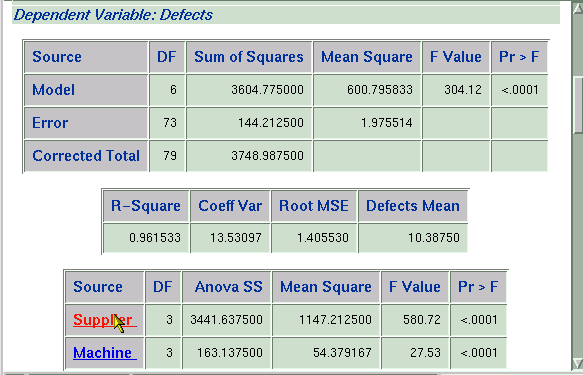
The following statements demonstrate how you can link a row of the ANOVA table to the corresponding multiple comparisons table. This is done by altering the display of values (inserting links) in the Source column of the ANOVA table. The links are inserted by using the TEMPLATE procedure.
   proc template;
      edit Stat.GLM.Tests;
         edit Source;
            translate _val_ = "Supplier" into
                 ('<a HREF="#IDX7">' || _val_ || '</a>'),
                      _val_ = "Machine"  into
                 ('<a HREF="#IDX10">' || _val_ || '</a>');
            end;
         end;
   run;
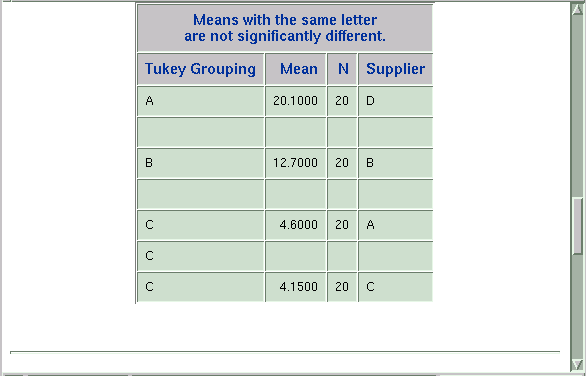
In order to determine the value to use in the HTML anchor link (<a HREF="">), you can run the analysis once and view information on your output in the Results node of the SAS Explorer. The anchor name `#IDX7' is given to the table "ANOVA.Means.Supplier.Defects.MCLines.Tukey.MCLines" (the anchor name is automatically generated in the SAS run). The statements create the Supplier label as a link that, when clicked, opens the table of means from the "Tukey's Studentized Range Test for Defects" associated with the Supplier variable.
The `#IDX10' anchor name is given to the table "ANOVA.Means.Machine.Defects.MCLines.Tukey.MCLines". The statements create the Machine label as a link that, when clicked, opens the table of means from the "Tukey's Studentized Range Test for Defects" associated with the Machine variable.
The following statements specify that ODS close the SAS listing destination and open the HTML destination. ODS writes the HTML output to the file 'anovab.htm'.
   ods listing close;
   ods html body='anovab.htm' ;
Since this is a balanced experiment, the ANOVA procedure computes the appropriate analysis, performed with the following statements:
   proc anova data=Experiment;
      class Supplier Machine;
      model Defects = Supplier Machine;
      means Supplier Machine / tukey;
   quit;

   ods html close;
The output from the ANOVA procedure is displayed in Output 15.11.1.
Output 15.11.1: HTML Output from the ANOVA Procedure: Linked Output

|

|
|
Chapter Contents |
Previous |
Next |
Top |
Copyright © 1999 by SAS Institute Inc., Cary, NC, USA. All rights reserved.