Chapter Contents
Previous
Next
|
Chapter Contents |
Previous |
Next |
| The BOXPLOT Procedure |
   symbol v=plus c=salmon;
   axis1 minor=none color=black label=(angle=90 rotate=0);
   title 'Analysis of Airline Departure Delays';
   title2 'BOXSTYLE=SKELETAL';

   proc boxplot data=times;
      plot delay * day /
                   boxstyle = skeletal
                   nohlabel
                   cframe   = vligb
                   cboxes   = dagr
                   cboxfill = ywh
                   vaxis    = axis1;
         label delay = 'Delay in Minutes';
   run;
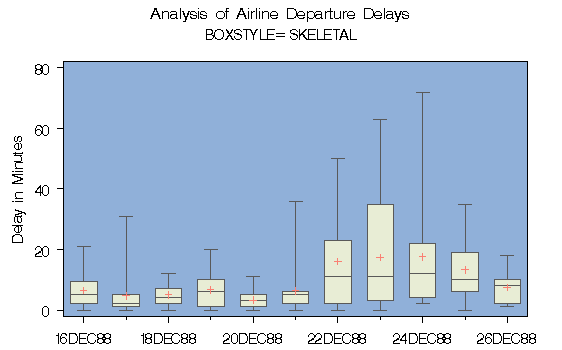
In a skeletal box-and-whisker plot, the whiskers are drawn from the quartiles to the extreme values of the group. The skeletal box-and-whisker plot is the default style; consequently, you can also request this style by omitting the BOXSTYLE= option.
Output 18.2.1: BOXSTYLE=SKELETAL
|
   title2 'BOXSTYLE=SCHEMATIC';
   proc boxplot data=times;
      plot delay * day /
                   boxstyle  = schematic
                   nohlabel
                   cframe   = vligb
                   cboxes   = dagr
                   cboxfill = ywh
                   idcolor  = salmon
                   vaxis    = axis1;
      label delay = 'Delay in Minutes';
   run;
The plot is shown in Output 18.2.2. When BOXSTYLE=SCHEMATIC is specified, the whiskers are drawn to the most extreme points in the group that lie within the fences. The upper fence is defined as the third quartile (represented by the upper edge of the box) plus 1.5 times the interquartile range (IQR). The lower fence is defined as the first quartile (represented by the lower edge of the box) minus 1.5 times the interquartile range. Observations outside the fences are identified with a special symbol. The default symbol is a square, and you can specify the shape and color for this symbol with the IDSYMBOL= and IDCOLOR= options. Serifs are added to the whiskers by default. For further details, see the entry for the BOXSTYLE= option.
Output 18.2.2: BOXSTYLE=SCHEMATIC

|
   title2 'BOXSTYLE=SCHEMATICID';
   proc boxplot data=times;
      plot delay * day /
                   boxstyle = schematicid
                   nohlabel
                   cboxes   = dagr
                   cboxfill = ywh
                   cframe   = vligb
                   idcolor  = salmon
                   vaxis    = axis1;
      id reason;
      label delay = 'Delay in Minutes';
   run;
The plot is shown in Output 18.2.3. If you specify BOXSTYLE=SCHEMATICID, schematic box-and-whisker plots are displayed in which the value of the first ID variable (in this case, reason) is used to label each observation outside the fences.
Output 18.2.3: BOXSTYLE=SCHEMATICID

|
   title2 'BOXSTYLE=SCHEMATICIDFAR';
   proc boxplot data=times;
      plot delay * day /
                   boxstyle = schematicidfar
                   nohlabel
                   cframe   = vligb
                   cboxes   = dagr
                   cboxfill = ywh
                   idcolor  = salmon
                   vaxis    = axis1;
      id reason;
      label delay   = 'Delay in Minutes';
   run;
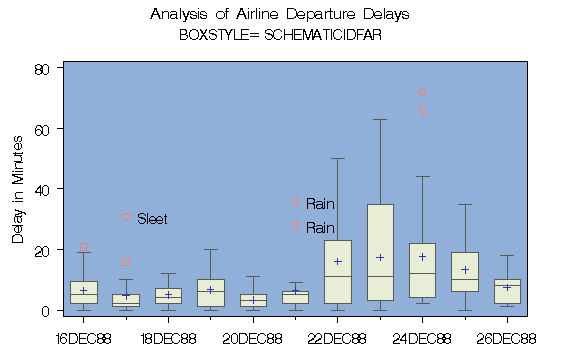
The plot is shown in Output 18.2.4. If you specify BOXSTYLE=SCHEMATICIDFAR, schematic plots are displayed in which the value of the first ID variable is used to label each observation outside the lower and upper far fences. The lower and upper far fences are located 3×IQR below the 25th percentile and above the 75th percentile, respectively. Observations between the fences and the far fences are identified with a symbol but are not labeled.
Output 18.2.4: BOXSTYLE=SCHEMATICIDFAR
|
|
Chapter Contents |
Previous |
Next |
Top |
Copyright © 1999 by SAS Institute Inc., Cary, NC, USA. All rights reserved.